Price Line
- Indicadores
- Versión: 1.1
- Actualizado: 18 noviembre 2021

Máximo, mínimo, apertura, cierre: ¿no es demasiado? A veces necesitas un historial único de precios. Pero si eliges una cosa, pierdes el resto. El suavizado también conlleva una pérdida de datos. A menudo se pierde uno de los detalles más importantes del mercado: la información sobre los extremos. Debido a la conservación de información sobre los máximos y mínimos, el "suavizado" correcto para la historia de precios es un zigzag. Pero los zigzags también tienen inconvenientes: no proporcionan valores intermedios.
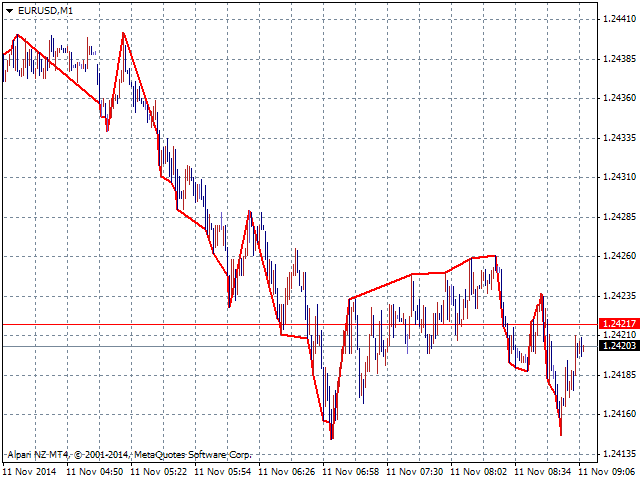
El indicador Línea de precio resuelve este problema trazando una línea en los máximos o en los mínimos, dependiendo de lo que necesite. Al igual que en el suavizado, puede haber cierto retraso, pero no es constante. A menudo, el indicador puede poner otro punto inmediatamente después del cierre de la barra, pero a veces hay que esperar más tiempo.
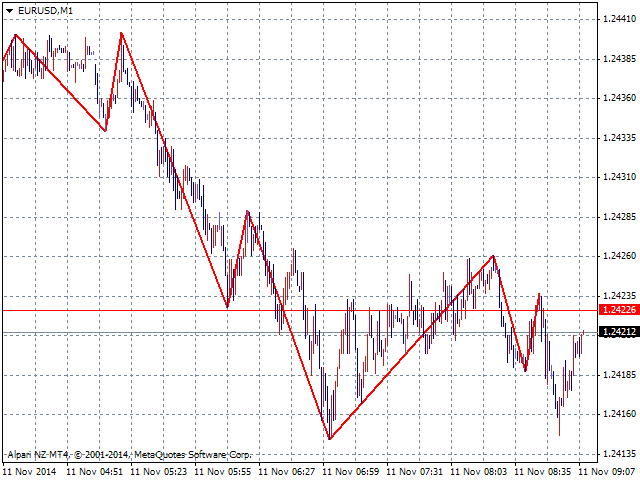
Trate esta línea de la misma manera que las que se suavizan tradicionalmente (por ejemplo, la media móvil), aunque pueda parecer inusual al principio. El resultado también puede mostrarse en forma de zigzag.
Parámetros
- Ordenar Línea de Precios - establece el método de "suavizado";
- Mostrar como ZigZag - establece el tipo de visualización;
- HistoryDepth - establece la profundidad de la historia en barras (si es 0 - toda la historia, si es inferior a 0 - el rango de fechas especificado);
- StartDate - establece la fecha de inicio del cálculo (para HistoryDepth < 0);
- StopDate - establece la fecha de finalización del cálculo (para HistoryDepth < 0).
El usuario no ha dejado ningún comentario para su valoración