Parabolic SAR MTF
- Indicadores
- Versión: 1.9
- Actualizado: 12 junio 2022
- Activaciones: 5

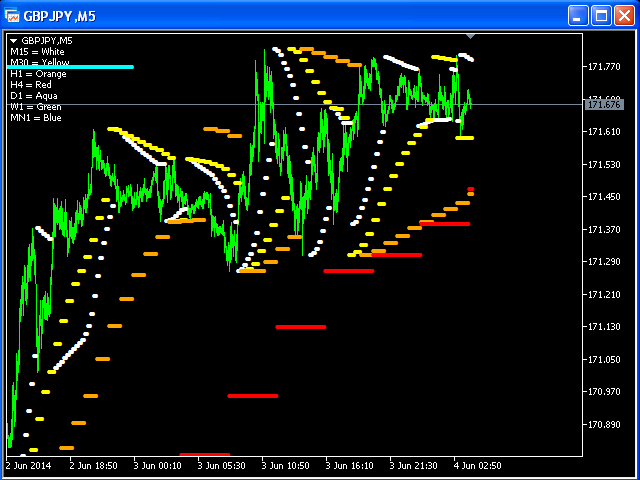
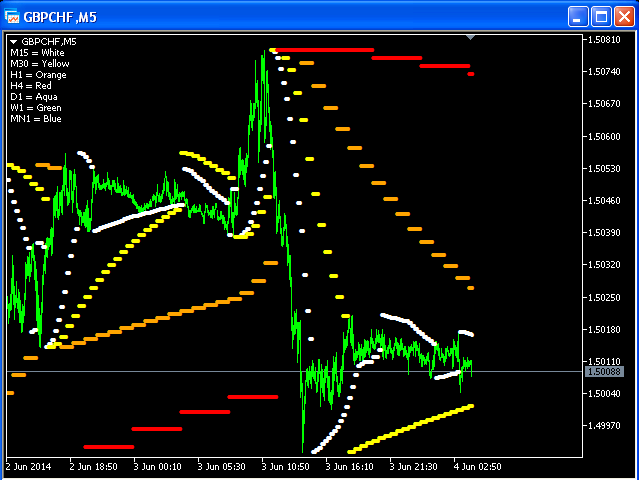
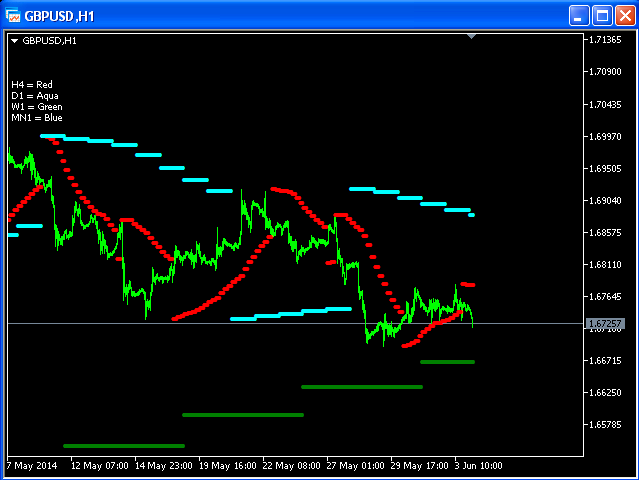
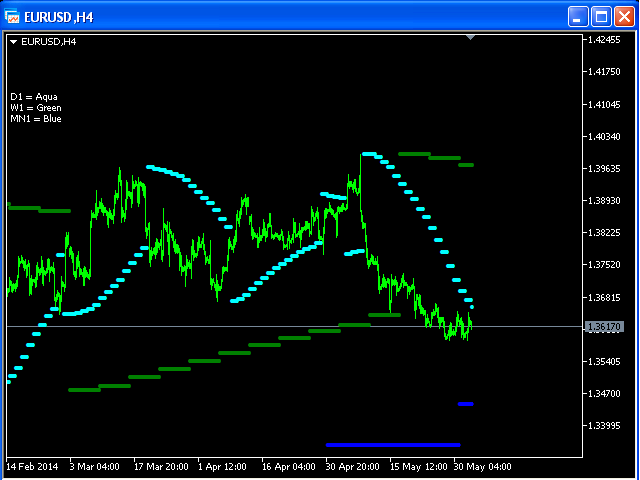
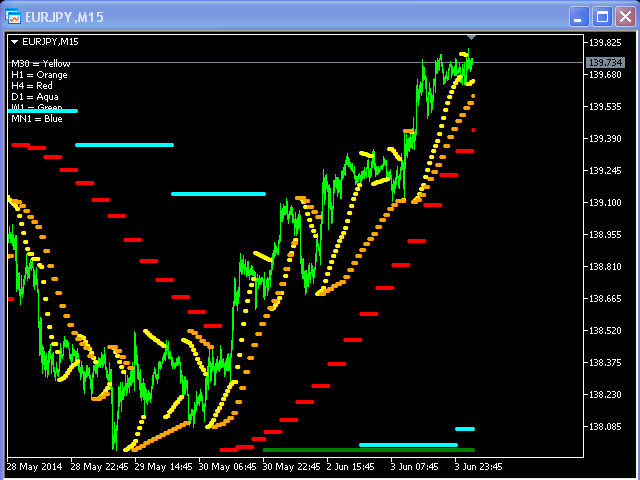
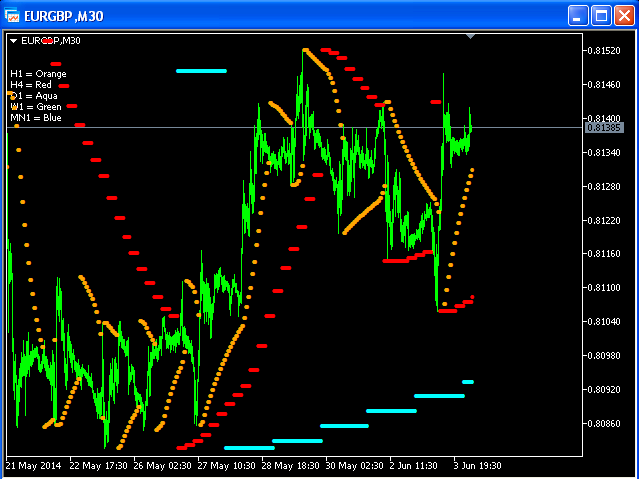
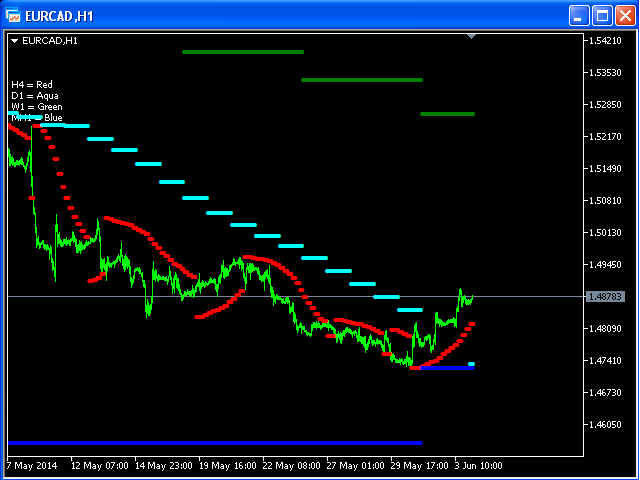
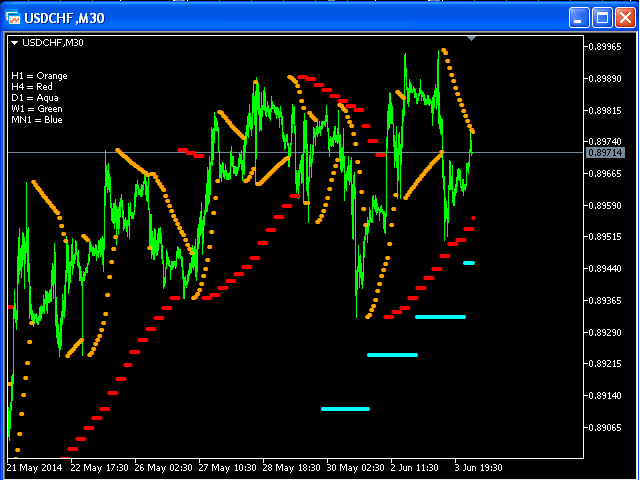
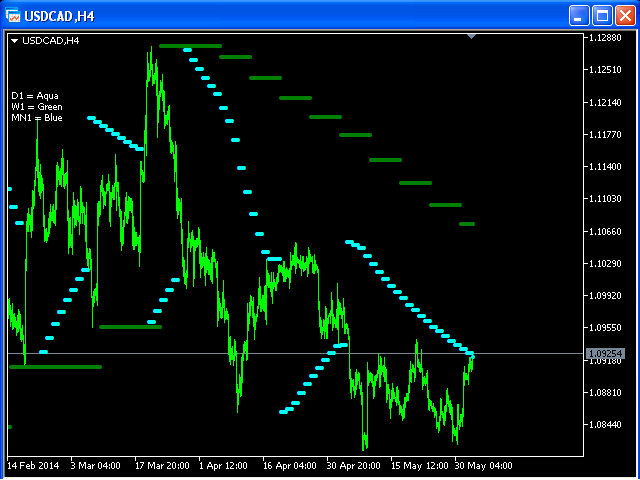
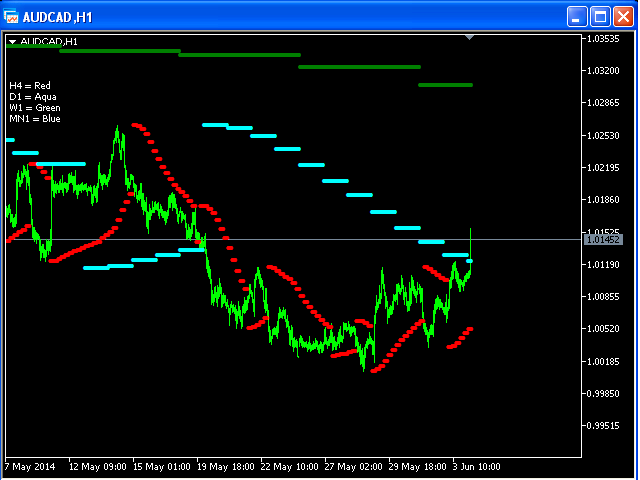
Se trata de una versión de múltiples marcos temporales del clásico indicador Parabolic SAR (siglas de "stop and reverse").
El PSAR sigue al precio como un indicador de seguimiento de tendencia. Una vez que una tendencia bajista se invierte y comienza a subir, el PSAR sigue los precios como un trailing stop.
Usted puede elegir los plazos para la visualización de PSAR en el gráfico.
Por supuesto, usted puede ver PSAR sólo de la corriente y los plazos más altos.
Parámetros de entrada:
- bM15 - PSAR de M15
- bM30 - PSAR de M30
- bH1 - PSAR desde H1
- bH4 - PSAR de H4
- bD1 - PSAR de D1
- bW1 - PSAR de W1
- bMN1 - PSAR de MN1
- Escalón - 0.02
- Máximo - 0.2