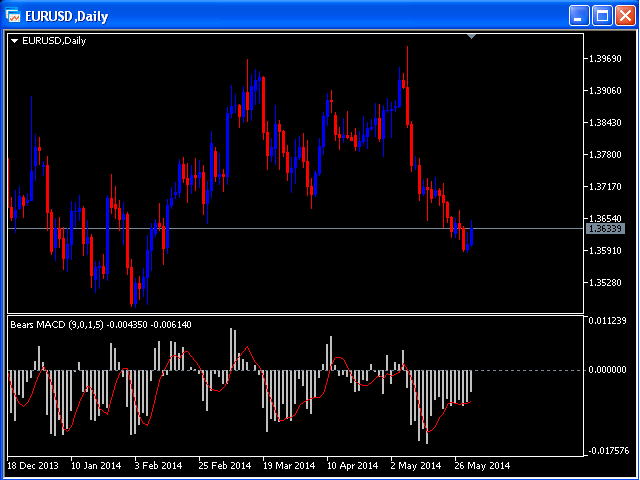
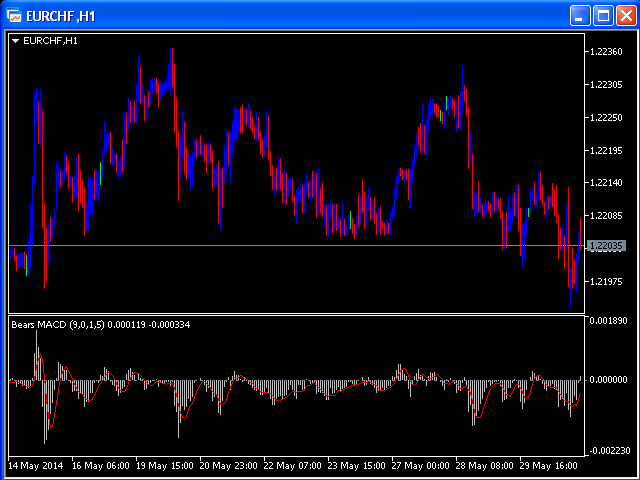
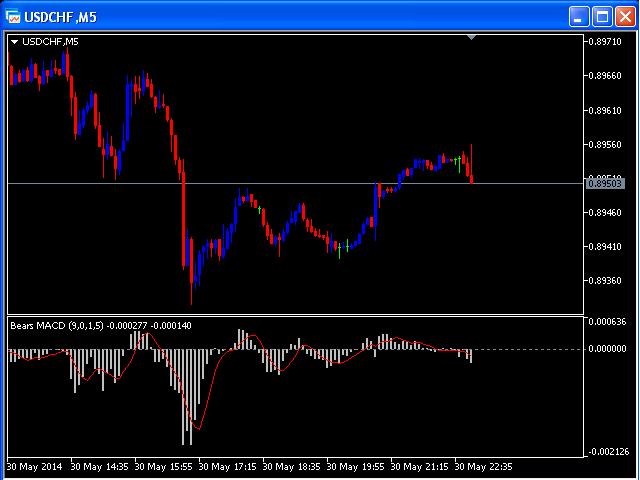
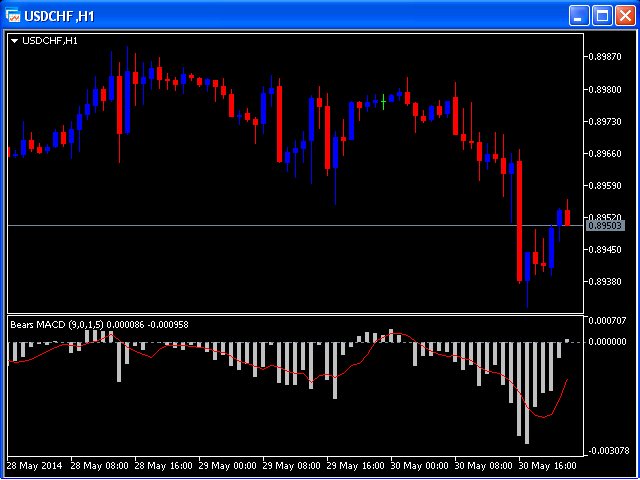
Bears MACD MT5
- Indicadores
- Versión: 2.5
- Actualizado: 19 noviembre 2021
- Activaciones: 5

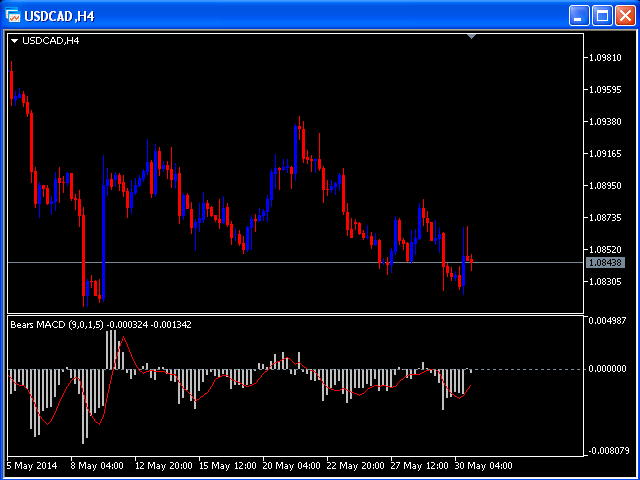
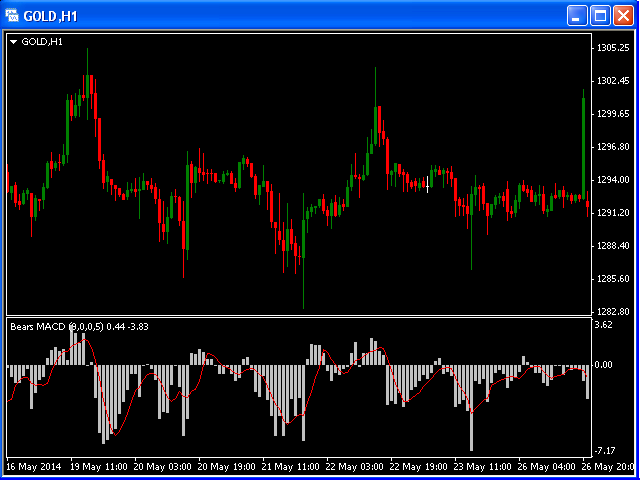
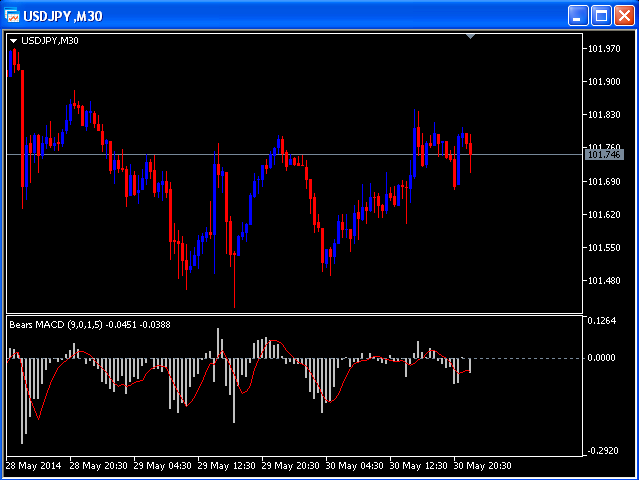
Este indicador es una combinación visual de 2 indicadores clásicos: Bears y MACD.
El uso de este indicador puede ser el mismo que ambos indicadores clásicos por separado o combinados.
Parámetros de entrada:
- input int BearsPeriod = 9;
- input ENUM_MA_METHOD maMethod = MODE_SMA;
- input ENUM_APPLIED_PRICE maPrice = PRICE_CLOSE;
- input int SignalPeriod = 5.