Abiroid Extreme TMA System Arrows Indicator
- Indicadores
-
Abir Pathak
 I create MT4 and MT5 indicators. They are mainly arrows and scanner indicators and also some essential utilities.
I'm hoping they will make your trading easier and make you profitable.
You can join my Telegram channel to keep track of all products I post. - Versión: 1.13
- Actualizado: 29 abril 2023
- Activaciones: 20
Sistema Extreme TMA con indicador de flechas
Y Cajas de Compra/Venta con Take Profit & Stop Loss
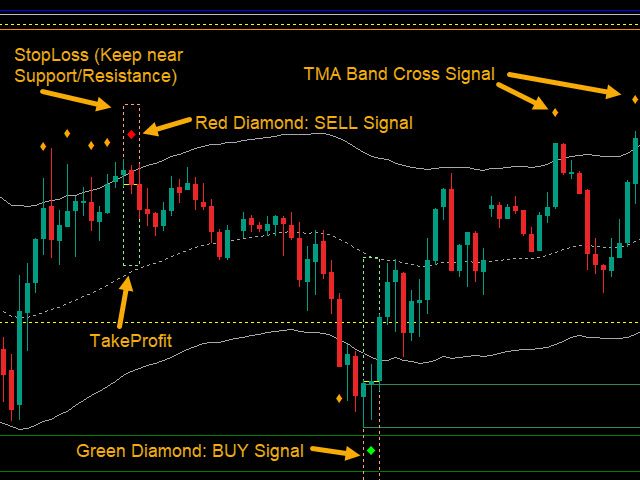
Este es un Indicador de Flechas sin Repintado basado en el Sistema Extreme TMA.
Muestra señales cruzadas de TMA y las mejores señales de COMPRA/VENTA. Junto con el TakeProfit más pronosticado. Y StopLoss basado en el ratio TakeProfit.
Tenga en cuenta: Este es un indicador de flechas solamente. Dashboard se vende por separado aquí:
Acerca del indicador:
Este indicador muestra flechas de señal de COMPRA/VENTA y también muestra el Take Profit más probable. Y Stop Loss se calcula en base a la relación que establece para StopLoss:TakeProfit.
Hay 3 bandas TMA: Bandas Superior, Media e Inferior.
Cuando el precio cruza la banda superior, se invertirá y dará una oportunidad de VENTA y si cruza las bandas inferiores, hay una oportunidad de COMPRA.
Una vez que la inversión ocurre el precio irá por lo menos hasta la banda media.
Para verificar esta inversión, tenemos que comprobar 3 cosas:
1. 1. Pendiente de la TMA (de los marcos de tiempo actual y superior)
2. Líneas de Soporte/Resistencia
3. RSI Sobrecomprado/Vendido
Sobre Soporte/Resistencia:
Si el precio está cerca del Soporte y cruza la banda inferior también, es probable que se invierta para COMPRAR.
Si el precio está cerca de la Resistencia y cruza la banda superior, es probable que se invierta para VENDER.
Condiciones de señal de COMPRA VENTA:
- Si useHeikenAshiPrice es verdadero - use precios Heiken Ashi
Si el precio ha cruzado las bandas superior/inferiorSi useRSI es verdadero y el precio está sobrecomprado/sobrevendido
Si checkCurrentTFSlope o checkHTFSlope - haga una verificación de la pendiente como se describe en la siguiente sección
Si "Ignore If TakeProfit Too Close" es verdadero - y el precio es menor que el porcentaje de "Min Distance from TakeProfit". Consulte la sección siguiente.
Si todas las condiciones coinciden, obtendrá una señal y alerta de COMPRA o VENTA. COMPRA es Fondo Verde. VENTA es fondo rojo.
Comprobación de Pendiente:
Si TMA_SlopeThreshold es 0.3.
Si Slope < -0.3 significa Tendencia Bajista entonces muestra solo Señales de VENTA. Ignora todas las señales de COMPRASi Slope > 0.3 significa que la tendencia es alcista y sólo muestra señales de COMPRA. Ignorar todas las señales de VENTA
Si la pendiente está entre -0,3 y 0,3 significa que el mercado está oscilando. Mostrar Señales de COMPRA y VENTA
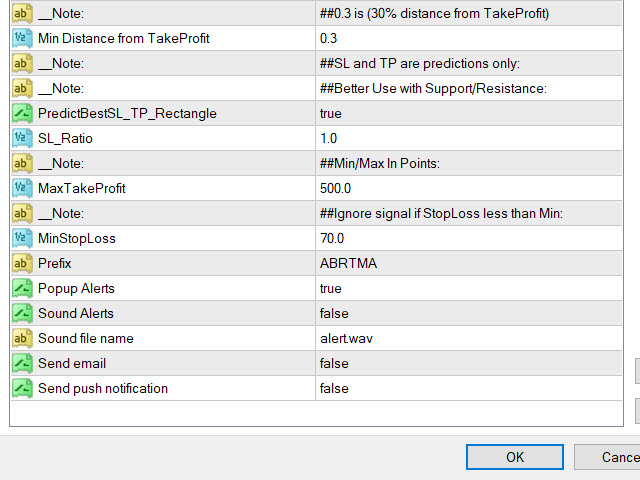
Si MinDistance es 0.3 significa 30%
Si el 100% de la distancia es entre la banda superior/inferior y la banda media.
Si la distancia entre la banda superior/inferior y el precio inicial ya es mayor al 30% entonces ignora la señal.
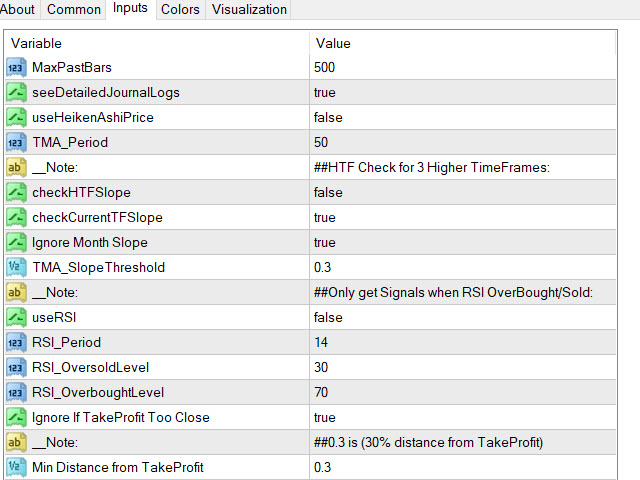
Propiedades del Indicador:
- TMA_Period = 50 (Período de la Media Móvil Triangular)- checkHTFSlope = false (Comprueba o no la pendiente de los próximos 3 marcos temporales superiores)
- checkCurrentTFSlope = true (Comprueba o no la pendiente del marco temporal actual)
- ignoreMNSlope = true (Ignora o no la pendiente del gráfico mensual)
- TMA_SlopeThreshold = 0.3 (Umbral de Pendiente para verificar alcista/bajista)
- useRSI = false (Si Use RSI true - solo opere COMPRAR si RSI SobreVendido y VENDER si RSI SobreComprado. De lo contrario ignorar la señal)
- RSI_Period = 14
- RSI_OversoldLevel = 30
- RSI_OverboughtLevel = 70
- ignoreTooCloseMiddleBand = true (TakeProfit será en algún lugar cerca de la banda media. Pero si el precio ya alcanzó demasiado cerca de la banda media luego ignorar la señal o no)
- minDistFromMiddleBand = 0,3 (0,3 significa 30% de distancia de la banda media. Si ignoreTooCloseMiddleBand true y el precio alcanza más del 30% de distancia de la banda media entonces ignorar la señal)
- PredictBestSL_TP_Rectangle = true (Obtener SL y TP son predicciones rectángulo. Tenga en cuenta que estas son predicciones. Usar con líneas de Soporte/Resistencia para validación)
- SL_Ratio = 1 (Ratio 1 significa que SL y TP serán 1:1. 0.5 significa que StopLoss será la mitad de TakeProfit)
- MaxTakeProfit = 500 (Si TakeProfit más de estos puntos, a continuación, restablecer a este máximo. Y restablecer StopLoss a este max * SL_Ratio)
- MinStopLoss = 70 (Ignorar la señal si StopLoss menos de Min Puntos)
Características:
Plataforma: Metatrader4Pares de divisas: Todos los pares
Horario: Todo el día
Time-frame: Todos los TimeFrames. Pero TF más altos H1, H4+ son mejores y más estables


fantastic indicator with many ways to set it to your liking, really better than many other TMA I have tried and which also had very few licenses and very few settings, thank you very much Abiroid