Abiroid Slopes Histogram
- Indicadores
-
Abir Pathak
 I create MT4 and MT5 indicators. They are mainly arrows and scanner indicators and also some essential utilities.
I'm hoping they will make your trading easier and make you profitable.
You can join my Telegram channel to keep track of all products I post. - Versión: 1.1
- Actualizado: 6 marzo 2021
El indicador Abiroid Multi Slope le permite calcular un histograma de pendiente para cualquier línea de cualquier indicador.
Histogram is for 1 slope line only, but slope values can be calculated for 3 lines total.
Para tener múltiples histogramas, añada tantos indicadores de Pendiente para indicadores personalizados como desee en el gráfico.
Sólo tiene que proporcionar el nombre del indicador, el valor del búfer, el período de la pendiente y el número máximo de barras hacia atrás.
Por defecto tiene cálculo de pendiente para el indicador TDI_v4.ex4.
No hay forma de especificar parámetros para su indicador personalizado.
Así que es mejor si usted tiene el archivo mq4 para el indicador personalizado para que pueda establecer los parámetros directamente dentro de ella.
Para obtener información detallada y para los indicadores adicionales:
https://abiroid.com/indicators/abiroid-slopes-histogram
Parámetros:
- Indicador Principal: Cualquier ex4 con una ruta relativa a la carpeta MQL4/Indicators. Por defecto TDI_v4.ex4 se encuentra dentro de la carpeta MQL4/Indicators/TDI. Asi que el valor especificado por defecto es "TDI/TDI_v4".
Para calcular la pendiente, debe especificar cualquier indicador personalizado para el que tenga un ex4.
Nota: Esto no funciona para los indicadores incorporados de Metatrader, a menos que tenga un archivo ex4 para ellos.
Tampoco hay forma de especificar parámetros para el indicador personalizado.
Así que será bueno si usted tiene mq4 de este indicador principal, para cambiar directamente los parámetros en su indicador personalizado.
- MaxPastBars: Número total de barras pasadas para las que se calcula la pendiente.
- Shift: Barra inicial a partir de la cual se calcula el histograma de pendiente. Supongamos que Shift es 0, comenzará en la vela 0.
- Refresh After Ticks: Refresca el valor de la pendiente cada pocos ticks. Mantenga esto más alto, en caso de que su Indicador Principal sea pesado, o de lo contrario el sobre-cálculo podría hacer que MT4 se cuelgue.
Parámetros de Pendiente:
Un total de 3 pendientes pueden ser calculadas: A,B,C. Por defecto las pendientes son para RSI, TSL y MBL para TDI. A modo de ejemplo.
Pendiente por defecto para la línea MBL de TDI.
- Nivel Alto: Nivel alto por encima del cual la pendiente en el histograma se marca en verde (en la pendiente superior se establece en 20).
- Nivel bajo : Nivel bajo por debajo del cual la pendiente se marca en rojo (en la pendiente anterior se establece en -20).
- Periodo de la pendiente: Cuántas barras hay entre 2 puntos de la pendiente.
Suponga que está calculando la pendiente de una Media Móvil. Esta línea roja es una Media Móvil de 50 periodos.ex4
Y necesita la pendiente de 2 puntos separados por 25 barras. Entonces necesita especificar 25 como periodo de la pendiente.
- Unidad de pendiente: Si Slope unit es la distancia vertical entre 2 puntos para el cálculo de Slope. Para TDI, y cálculos de pendiente de RSI, MBL y TSL, la unidad es mejor mantenerla en 0.01.
Pero cuando se utiliza una Media móvil, el punto de precio se utiliza como unidad. Si mantiene la Unidad de Pendiente como 0, utilizará el Punto del Par por defecto.
Por ejemplo: EURUSD, el punto es 0.00001. USDJPY, el punto es 0.001
- Buffer: El buffer de la línea para la que necesita la pendiente. Lo mejor es comprobar el código mq4 para su indicador personalizado. Porque los buffers a veces están ocultos.
O si solo tiene ex4, entonces use la Ventana de Datos para encontrar el Buffer. Tenga en cuenta que la cuenta del buffer comienza en 0.
En TDI_v4:
La línea actual del RSI es el buffer 4. Es por eso que siempre es recomendable usar archivos mq4 de su Indicador Personalizado. Si el histograma de la pendiente se siente incorrecto, la causa más probable es que usted tiene un buffer incorrecto.
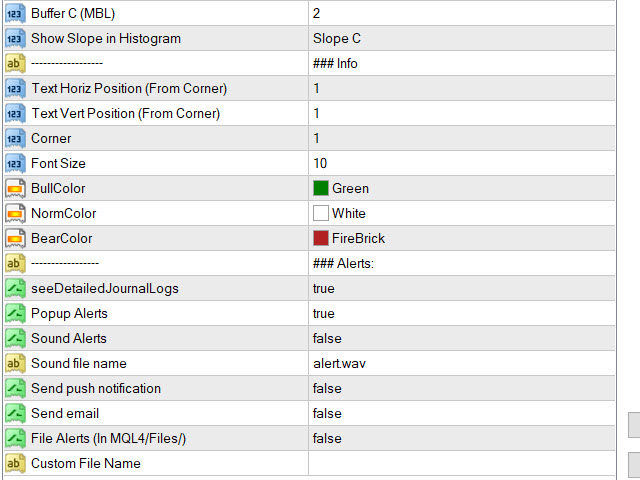
- Mostrar la pendiente en el histograma: En un histograma sólo se puede ver una pendiente a la vez. Pero puede añadir este indicador de Pendiente tantas veces como quiera al gráfico. Para obtener múltiples histogramas.
- Mostrar Información de Pendiente: Establece la posición, esquina, fuente, color, etc. para mostrar la información de pendiente para las pendientes A,B,C.
- Alertas: Obtenga alertas emergentes, notificaciones móviles, correo electrónico, archivos, etc.
Conclusión:
Los cálculos de pendiente son muy útiles en sus indicadores y EAs donde usted necesita saber la dirección que una línea está tomando. Por ejemplo, una MA ascendente indica una tendencia alcista y una MA descendente indica una tendencia bajista.
Por otro lado, las pendientes de las bandas de Bollinger pueden indicar si el mercado está en tendencia, si la banda superior está inclinada hacia arriba y la banda inferior está inclinada hacia abajo.
O si el mercado está oscilando, si las pendientes de ambas bandas se están aplanando. Otro buen ejemplo es la pendiente de la banda central COG, que indicará la compra de operaciones sólo si las bandas COG se están moviendo hacia arriba. Y muchos otros escenarios útiles.