Candle Pattern Scanner
- Indicadores
- Versión: 1.0
- Activaciones: 5

Patrones de velas
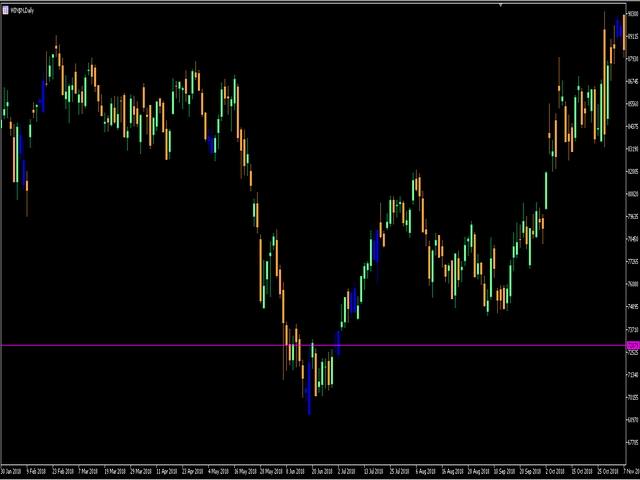
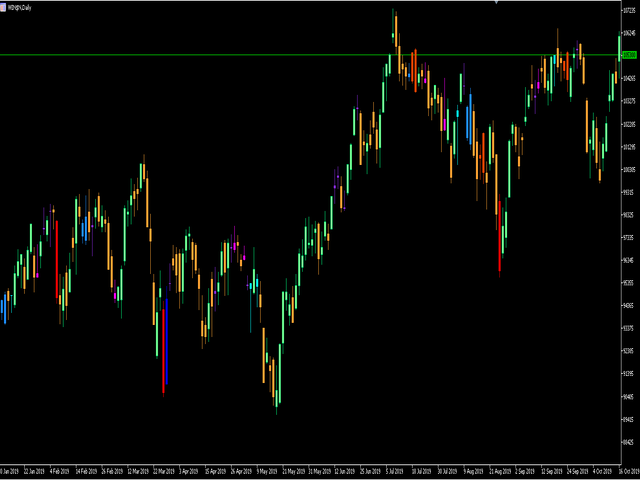
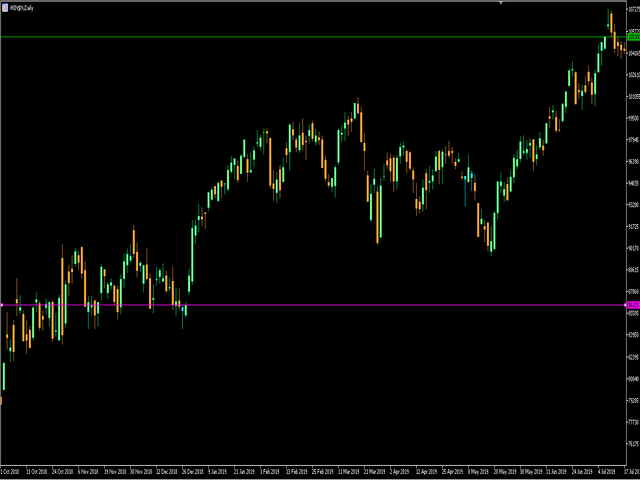
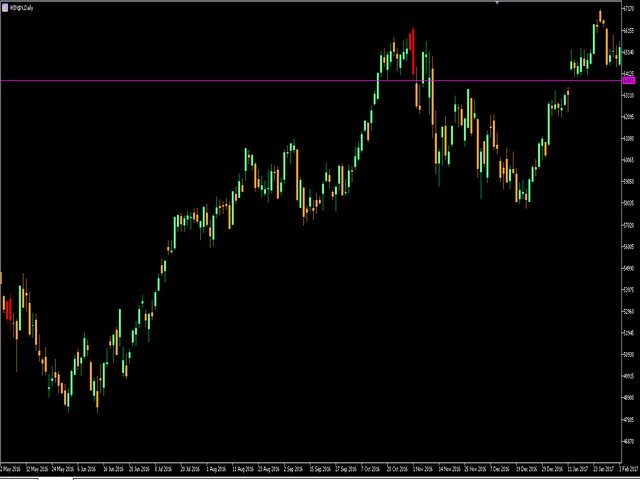
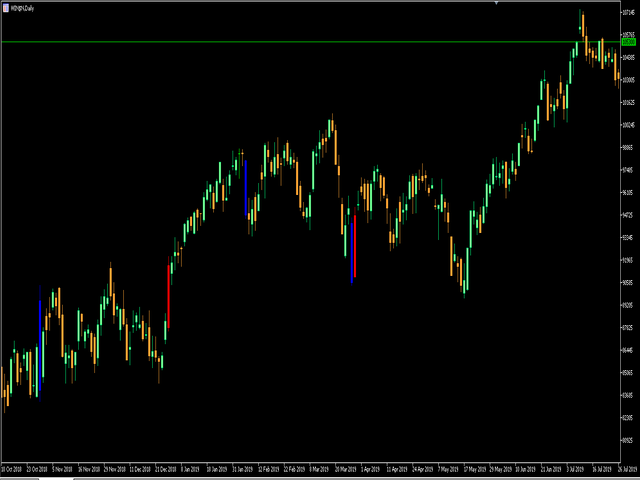
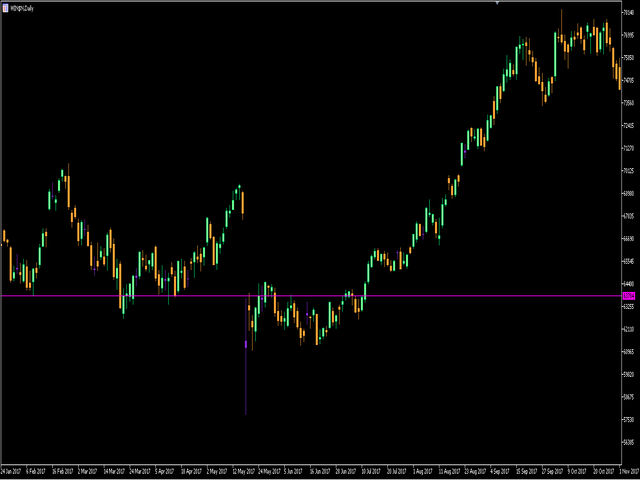
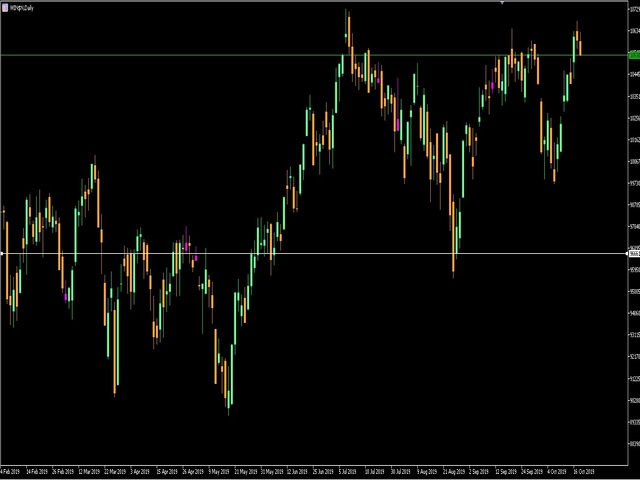
El indicador y escáner de patrones de velas está diseñado para ser una herramienta de ayuda completa para que los operadores discrecionales encuentren y analicen gráficos a partir de potentes patrones de velas.
Patrones reconocidos:
Martillo
Estrella fugaz
Envolvente bajista
Engulfado alcista
Doji
Marubozu
Escáner
Imagina que pudieras mirar todos los activos del mercado en todos los marcos temporales buscando señales de velas.


El usuario no ha dejado ningún comentario para su valoración