KT Inside Bar MT5
- Indicadores
-
KEENBASE SOFTWARE SOLUTIONS
 Visite nuestro sitio web para acceder a herramientas de trading gratuitas, tutoriales y guías detalladas de nuestros productos:
https://www.keenbase-trading.com - Versión: 1.0
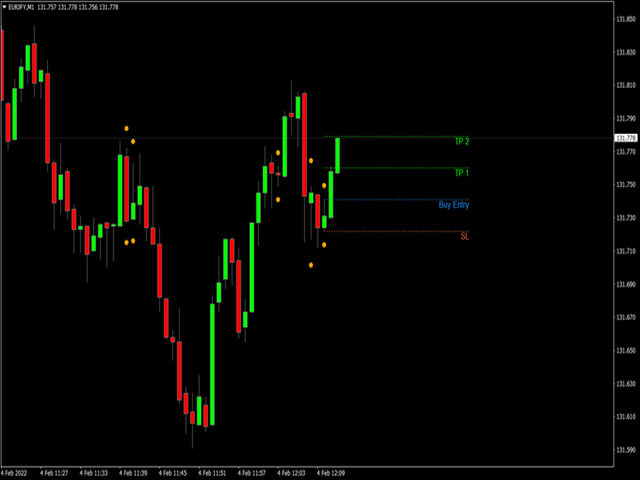
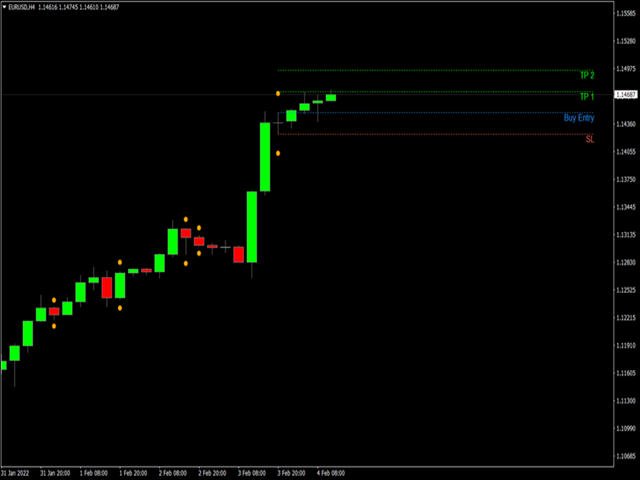
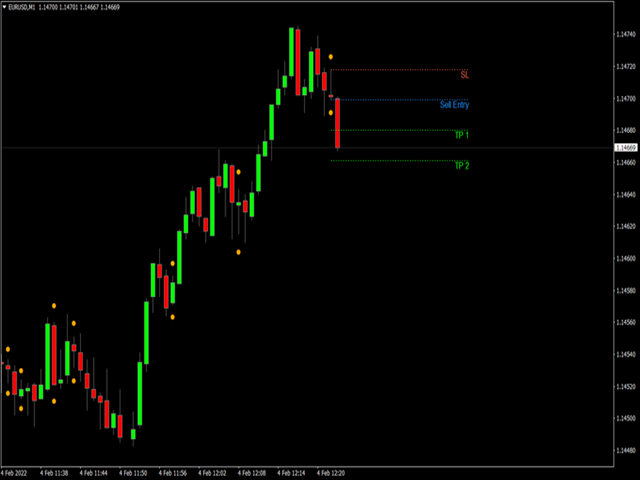
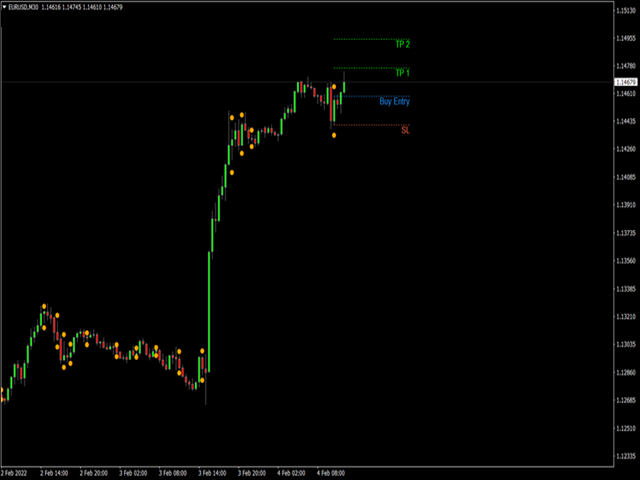
KT Inside Bar traza el famoso patrón de barra interior en el que la barra lleva un máximo más bajo y un mínimo más alto en comparación con la barra anterior. La última barra también se conoce como la barra madre. En marcos de tiempo más pequeños, la barra interior a veces aparece similar a un patrón de triángulo.
Características
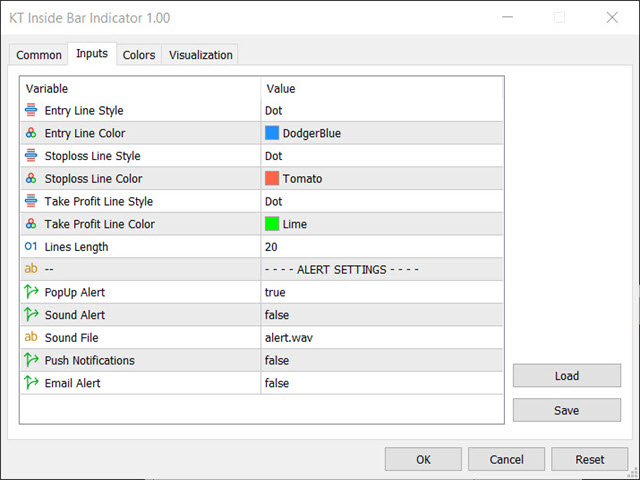
- También traza los niveles de entrada, stop-loss y take-profit con el patrón inside bar.
- Sin entradas ni ajustes complejos.
- Borra los niveles no deseados cuando el precio alcanza la línea de entrada en cualquier dirección.
- Incluye todas las alertas de Metatrader.
Cómo operar con Inside Bar
Las barras internas son usualmente operadas usando órdenes pendientes de compra y venta en el máximo o mínimo de la barra anterior (barra madre). La mayoría de las veces, el patrón de la barra interior proporciona entradas de ruptura en la dirección de la tendencia. Las barras internas generalmente no se recomiendan para operar los retrocesos.
También proporciona niveles de Stoploss y Takeprofit. Sin embargo, los operadores veteranos deben decidir las entradas y los objetivos utilizando un análisis más detallado.