PZ Supply Demand
- Indicadores
- Versión: 2.2
- Actualizado: 21 octubre 2020
- Activaciones: 20

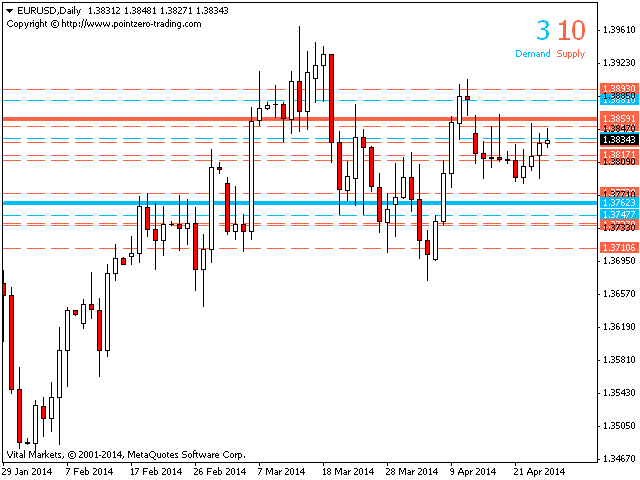
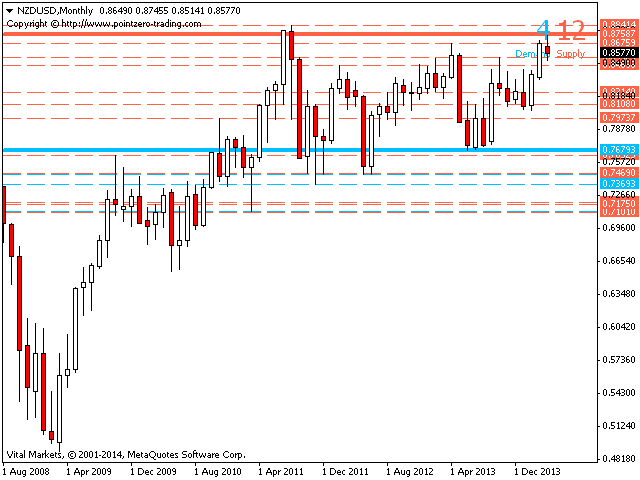
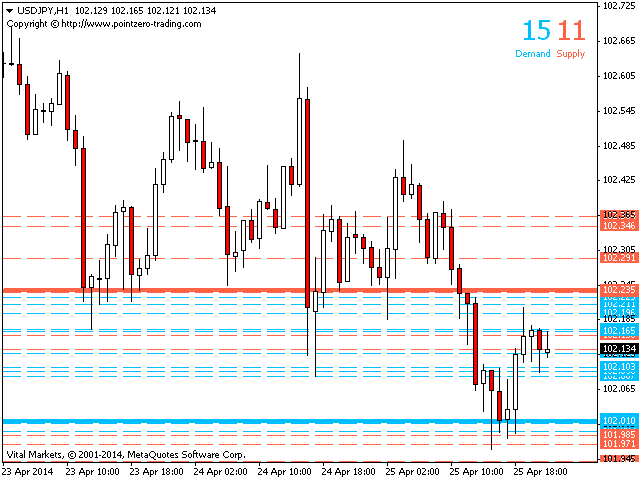
Este indicador analiza la acción pasada de los precios para anticipar la presión de compra y venta en el mercado: lo hace mirando hacia atrás en el pasado y analizando los picos y valles de precios en torno al precio actual. Es un indicador de confirmación de última generación.
[ Guía de instalación | Guía de actualización | Solución de problemas | FAQ | Todos los productos ]
- Predecir la presión de compra y venta en el mercado
- Evite quedar atrapado comprando vendiendo frenéticos
- No se necesita configuración ni optimización
- El indicador funciona en todos los plazos.
- Extremadamente fácil de usar.
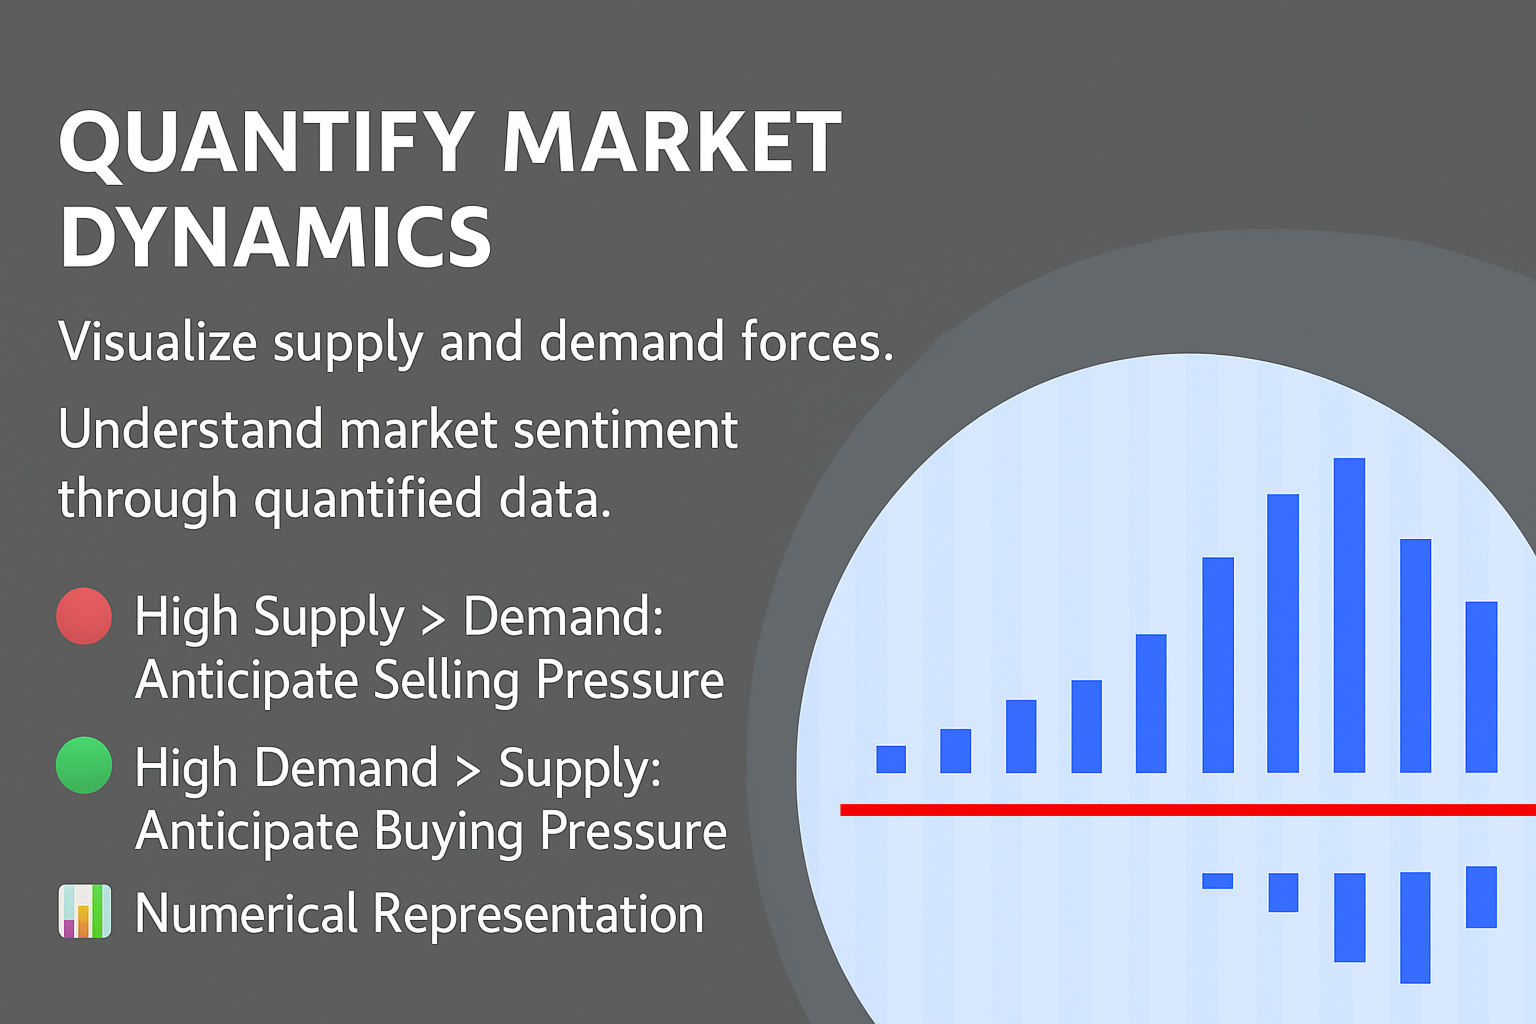
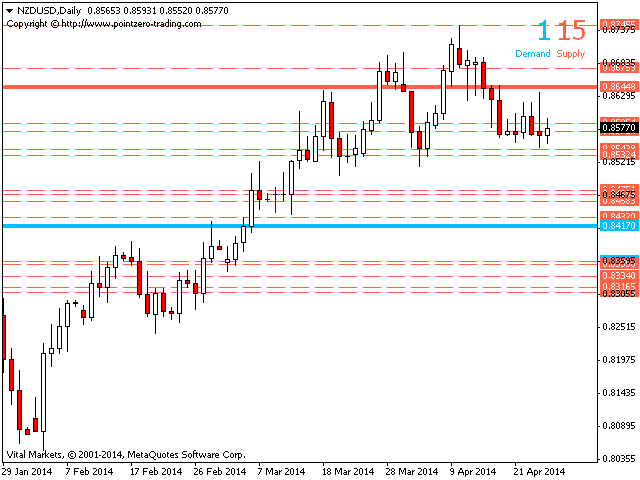
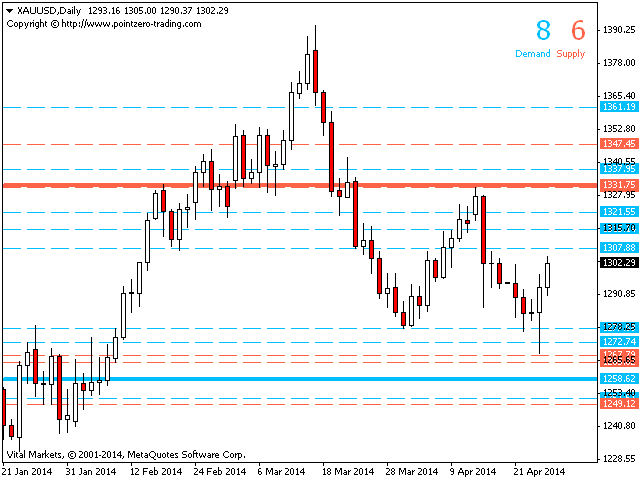
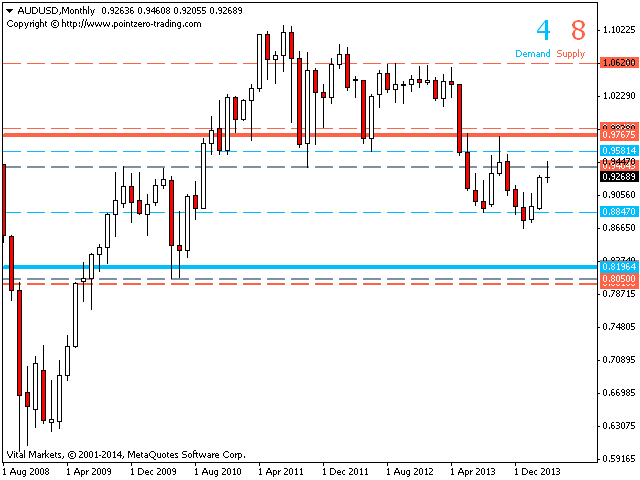
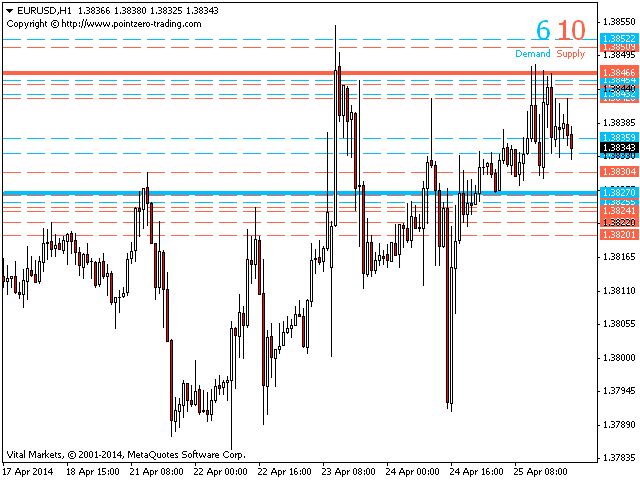
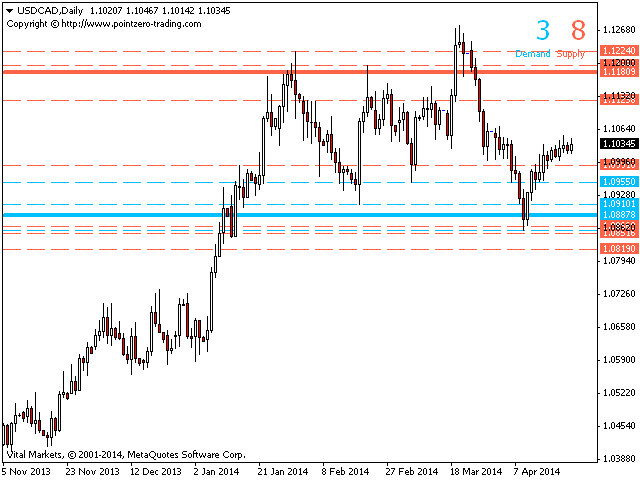
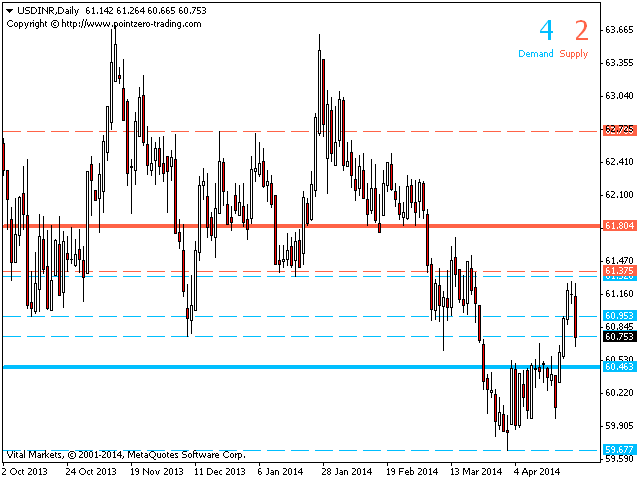
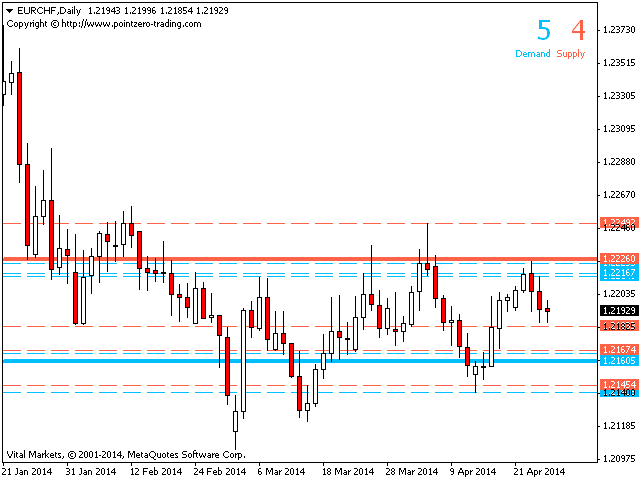
Los precios potenciales de oferta y demanda son aquellos en los que es probable que muchos participantes del mercado mantengan sus posiciones perdedoras, con la esperanza de liquidarlas en el punto de equilibrio. Por lo tanto, hay una actividad masiva en estos niveles de precios.
- Tanto la oferta como la demanda se cuantifican como números
- Si la oferta está por encima de la demanda, puede esperar presión de venta
- Si la oferta está por debajo de la demanda, puede esperar presión de compra
- Busque cortos cuando la oferta esté por encima de la demanda
- Busque largos cuando la oferta está por debajo de la demanda
Parámetros de entrada
- Rango: multiplicador de volatilidad alrededor del precio actual para buscar picos y valles en el pasado.
Autor
Arturo López Pérez, inversor privado y especulador, ingeniero de software y fundador de Point Zero Trading Solutions.


u are my Hero!!! 6 stars
used with Turtle Trading and Trade Manager Pro ;-)
thank you!