PZ Supply Demand
- Göstergeler
- Sürüm: 2.2
- Güncellendi: 21 Ekim 2020
- Etkinleştirmeler: 20

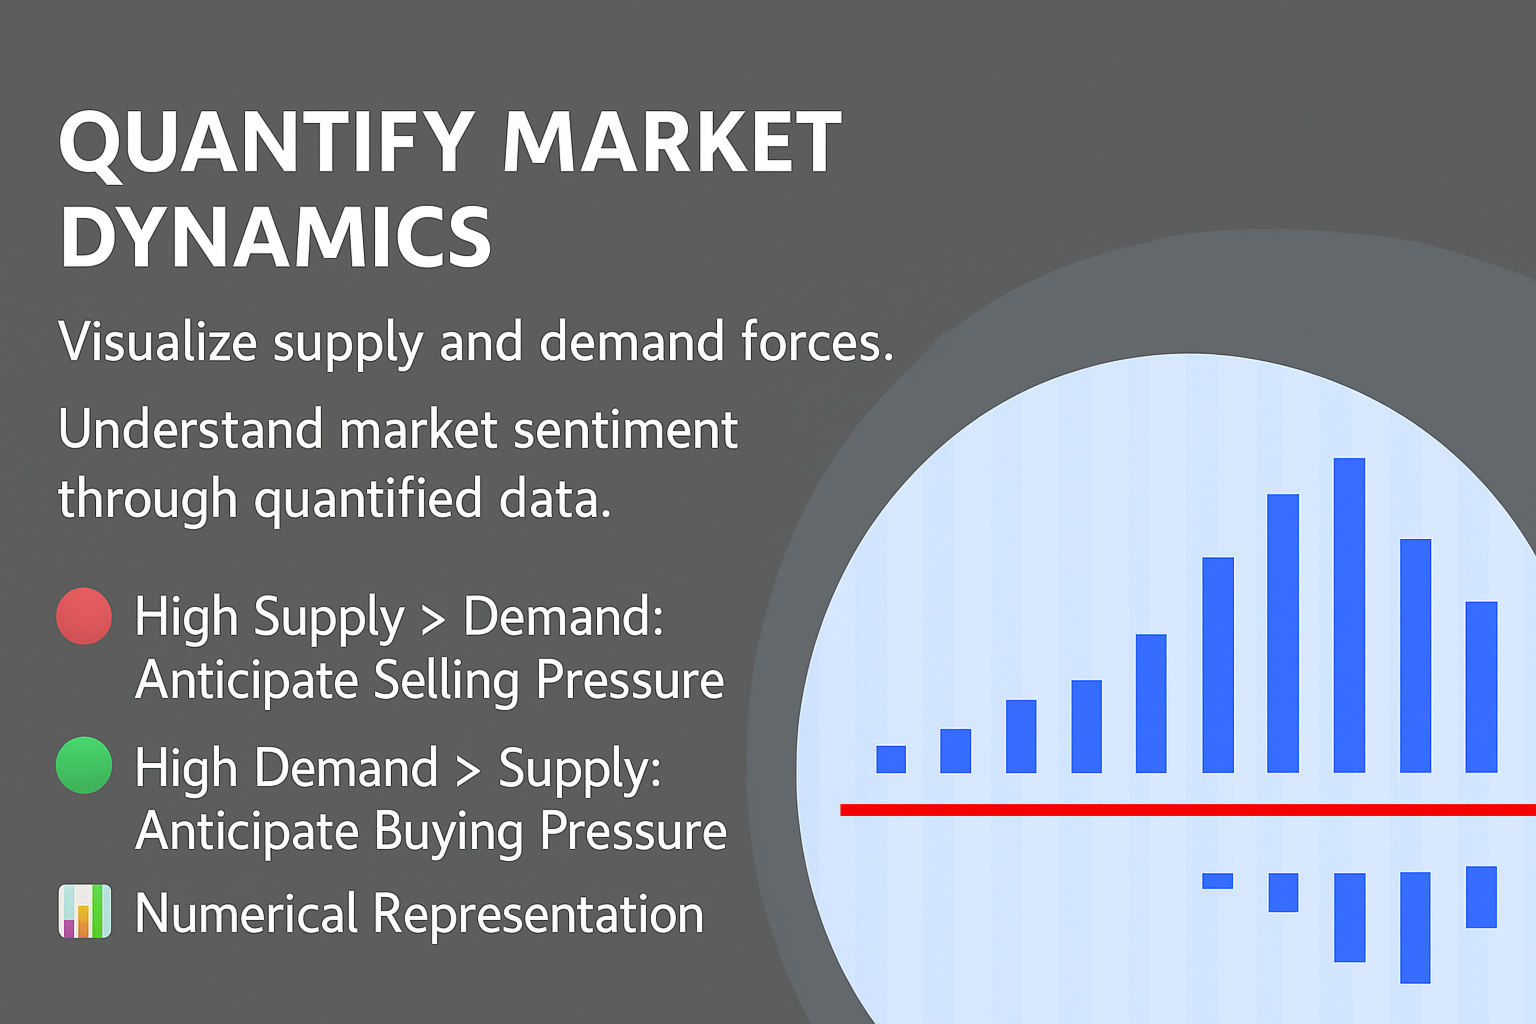
Stay ahead of the market: predict buying and selling pressure with ease
This indicator analyzes past price action to anticipate buying and selling pressure in the market: it does so by looking back into the past and analyzing price peaks and valleys around the current price. It is a state-of-the-art confirmation indicator.
[ Installation Guide | Update Guide | Troubleshooting | FAQ | All Products]
- Predict buying and selling pressure in the market
- Avoid getting caught in buying selling frenzies
- No settings and no optimization needed
- The indicator works in all timeframes
- Extremely easy to use
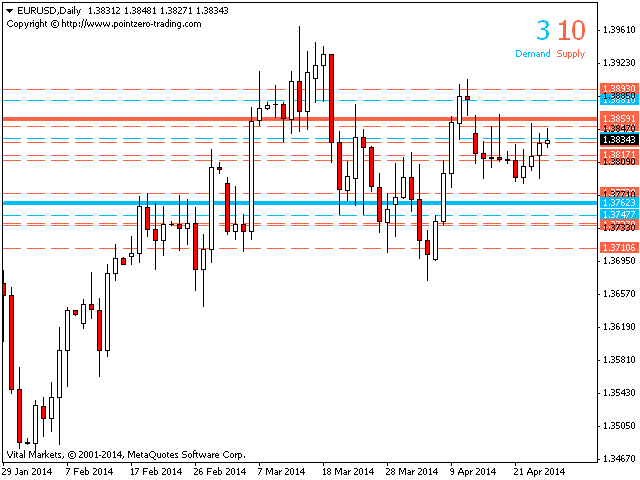
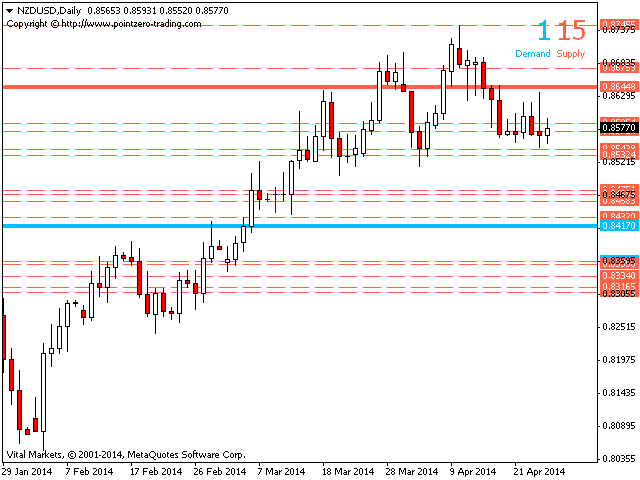
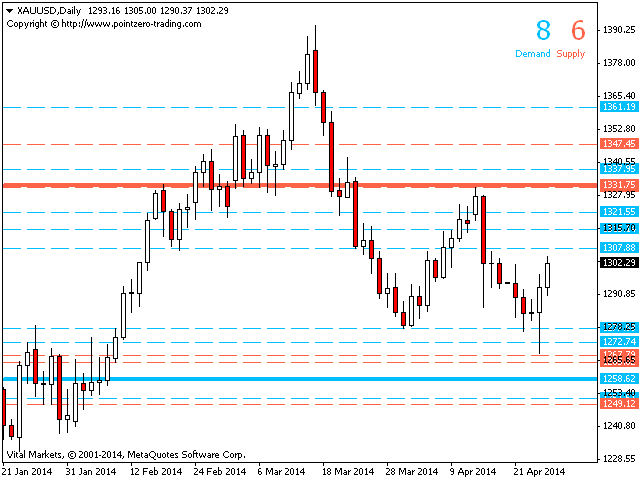
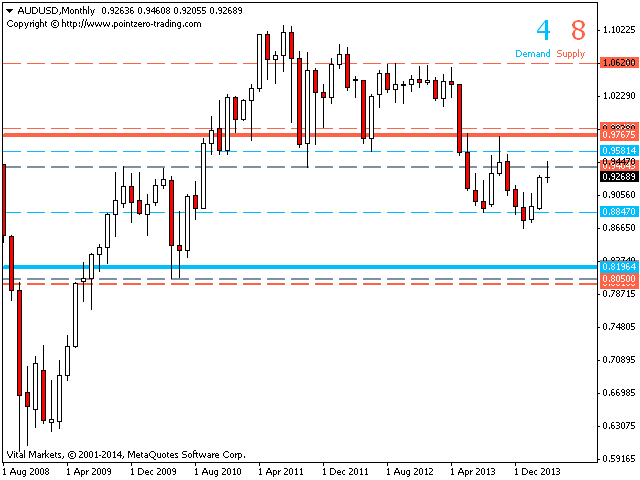
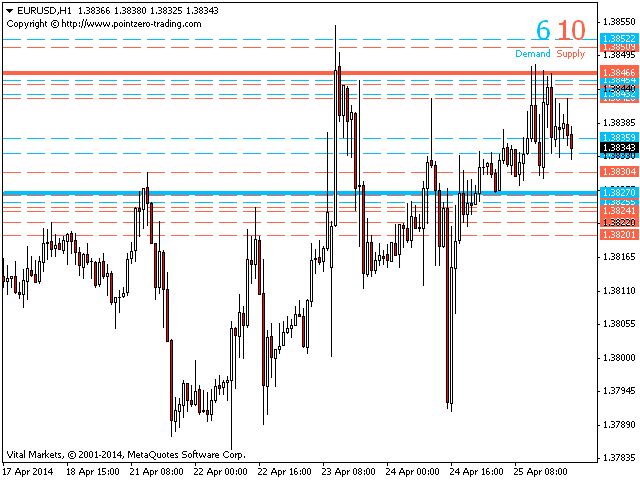
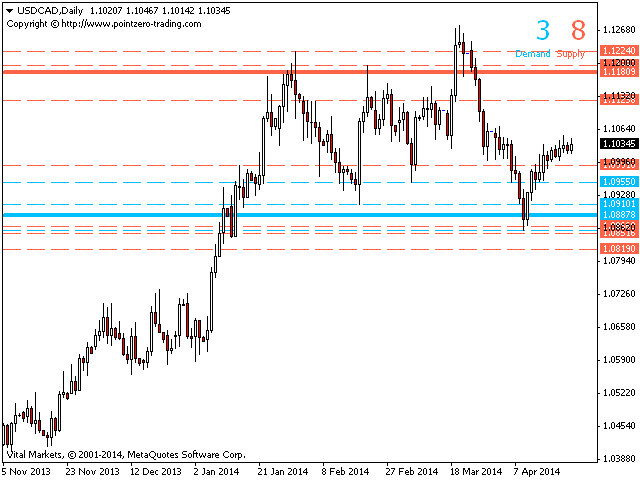
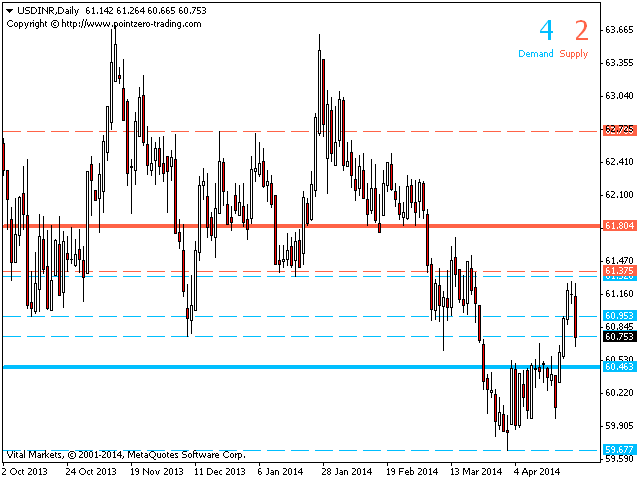
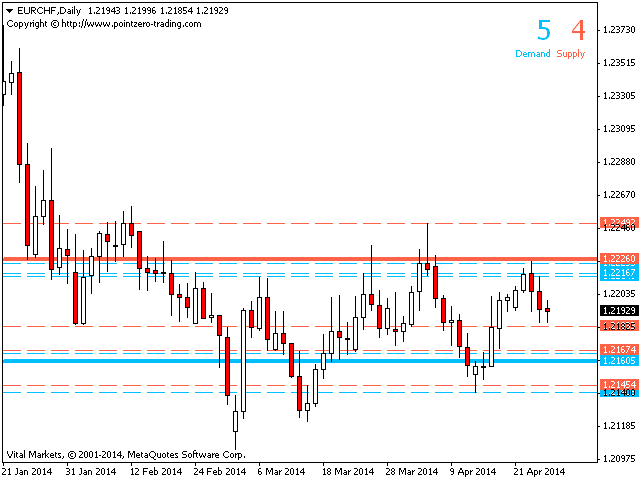
Potential supply and demand prices are those at which lots of market participants are likely to be holding their losing positions, hoping to liquidate them at break-even. Thus there is massive activity at these price levels.
- Both supply and demand are quantified as numbers
- If supply is above demand, you can expect selling pressure
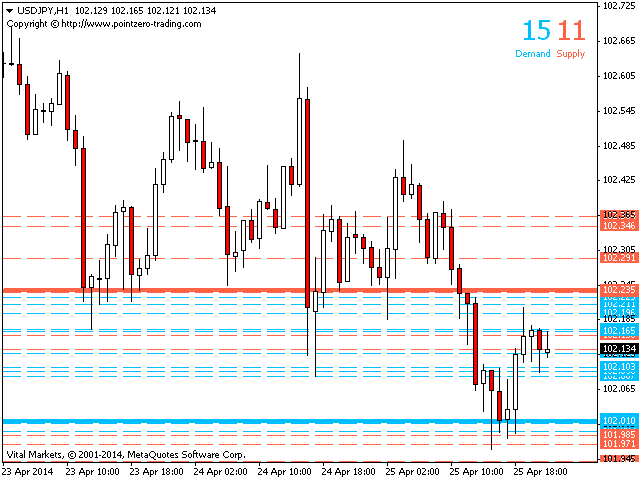
- If supply is below demand, you can expect buying pressure
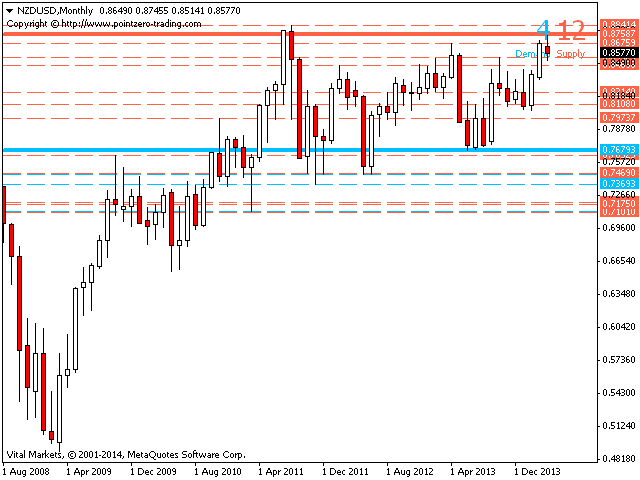
- Look for shorts when supply is above demand
- Look for longs when supply is below demand
Input Parameters
- Range: Volatility multiplier around the current price to search peaks and valleys in the past.
Author
Arturo López Pérez, private investor and speculator, software engineer and founder of Point Zero Trading Solutions.


u are my Hero!!! 6 stars
used with Turtle Trading and Trade Manager Pro ;-)
thank you!