PZ Supply Demand
- インディケータ
- バージョン: 2.2
- アップデート済み: 21 10月 2020
- アクティベーション: 20

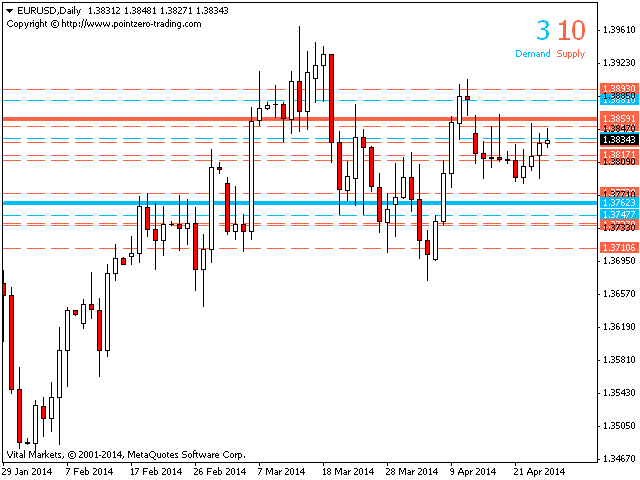
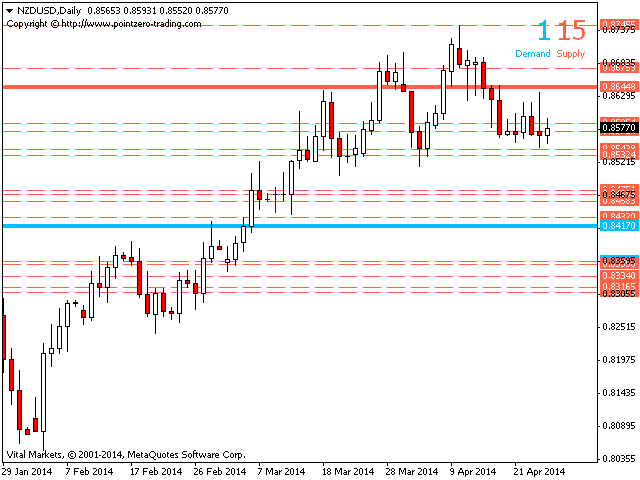
このインディケータは、過去の価格行動を分析して市場の売買圧力を予測します。過去を振り返り、現在の価格周辺の価格のピークと谷を分析します。これは、最新の確認インジケータです。
[ インストールガイド | 更新ガイド | トラブルシューティング | よくある質問 | すべての製品 ]
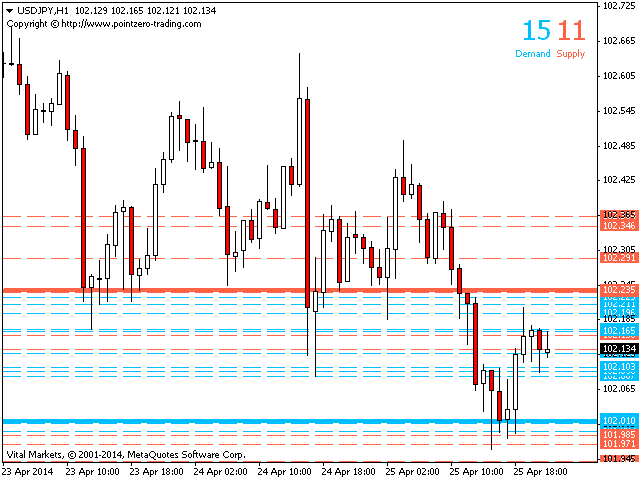
- 市場での売買圧力を予測する
- フレンジーを売って買うことに巻き込まれないようにする
- 設定も最適化も不要
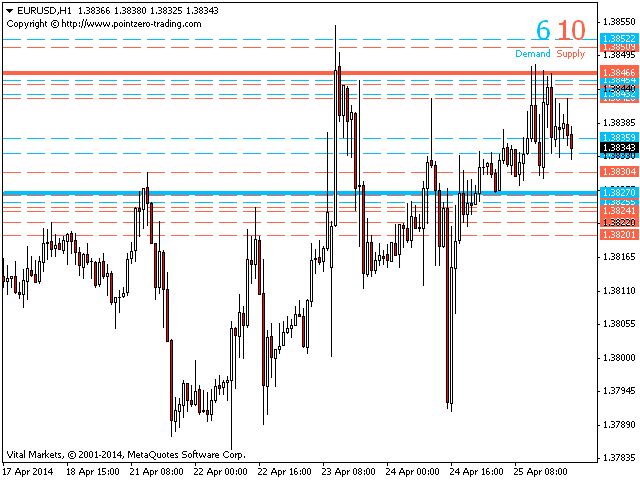
- インジケーターはすべての時間枠で機能します
- 非常に使いやすい
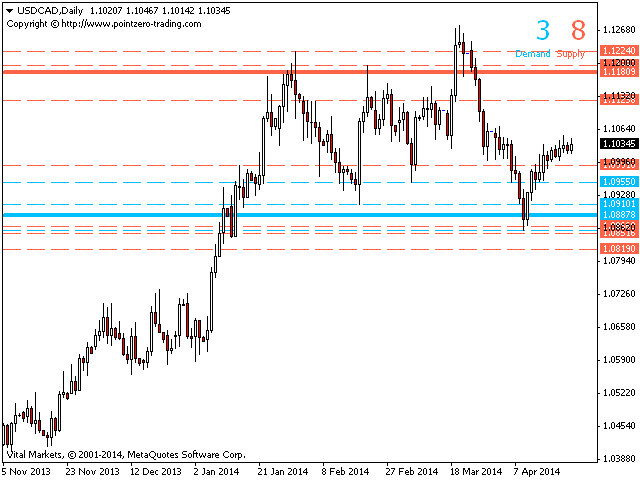
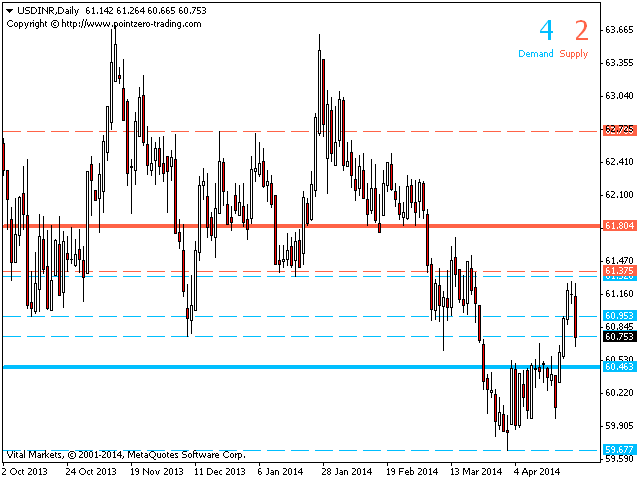
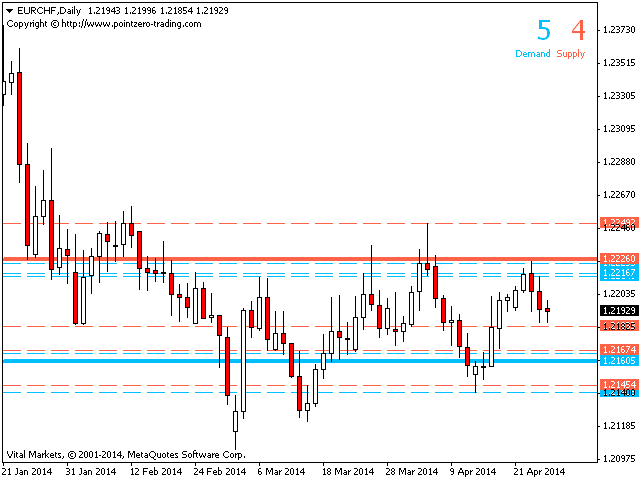
潜在的な供給価格と需要価格は、多くの市場参加者が負けポジションを維持し、損益分岐点でそれらを清算することを望んでいる価格です。したがって、これらの価格レベルで大規模な活動があります。
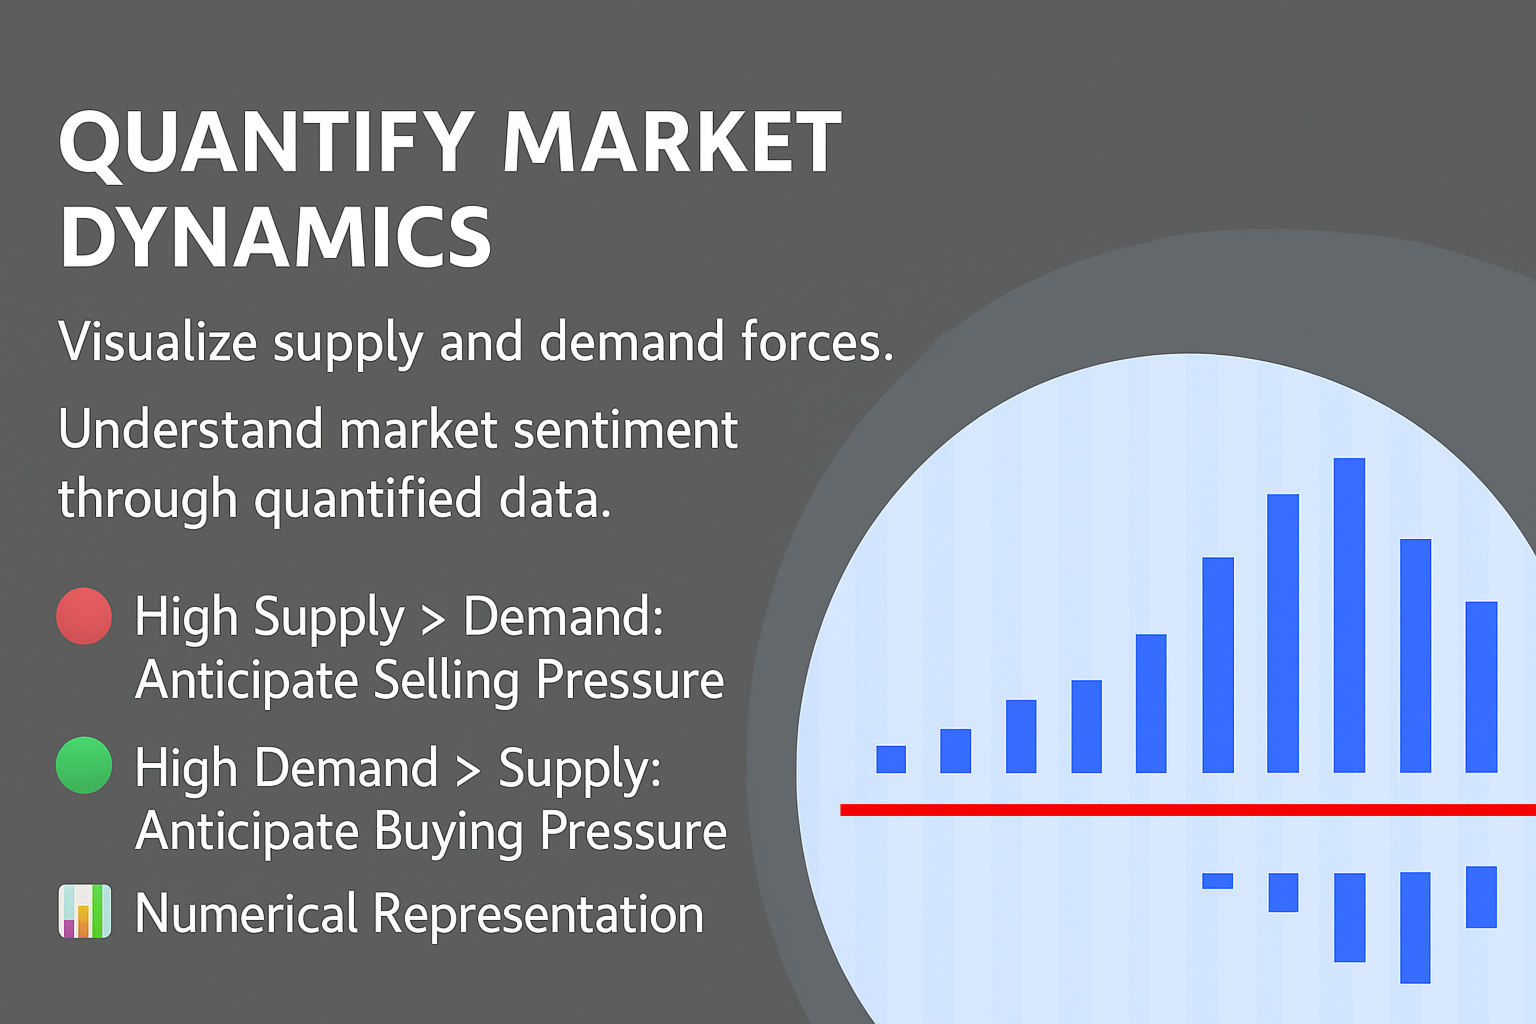
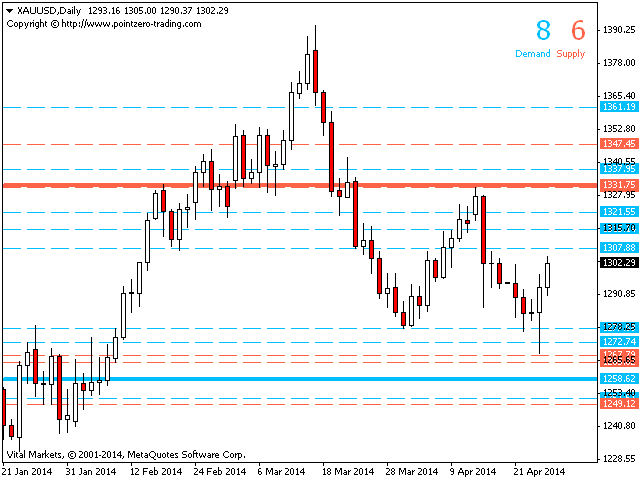
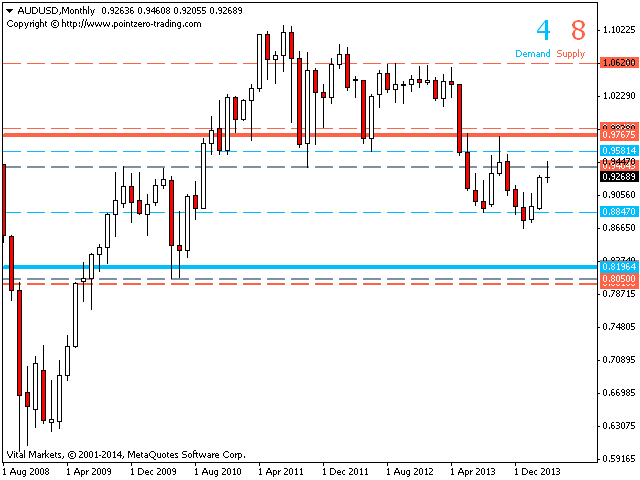
- 需要と供給の両方が数値として定量化されます
- 供給が需要を上回る場合、販売圧力が予想されます
- 供給が需要を下回っている場合、購入圧力が予想されます
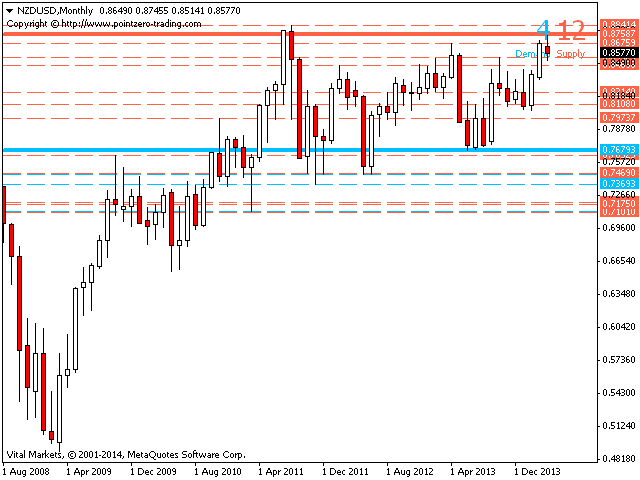
- 供給が需要を上回っている場合はショートを探してください
- 供給が需要を下回っている場合は、長期を探してください
入力パラメータ
- 範囲:過去のピークと谷を検索するための現在の価格のボラティリティ乗数。
著者
ArturoLópezPérez、個人投資家および投機家、ソフトウェアエンジニア、Point Zero Trading Solutionsの創設者。


u are my Hero!!! 6 stars
used with Turtle Trading and Trade Manager Pro ;-)
thank you!