Elliott WAVE Manual Marking Tool
- Indicadores
- Versión: 2.11
- Actualizado: 7 octubre 2021
- Activaciones: 5
La mayoría de los que operan en Forex conocen el Sistema de Análisis de Ondas de Elliott. Entonces, ¿qué es este análisis de ondas: Es el estudio y análisis del precio, y no de sus derivados (diversos indicadores); La capacidad de determinar los objetivos de precio utilizando herramientas de Fibonacci (las ondas de Elliott están estrechamente relacionadas con los números de Fibonacci). Se puede obtener una imagen clara del mercado en todas las escalas de tiempo; Con EWA, es posible construir un sistema de trading con una descripción clara de las entradas y salidas.
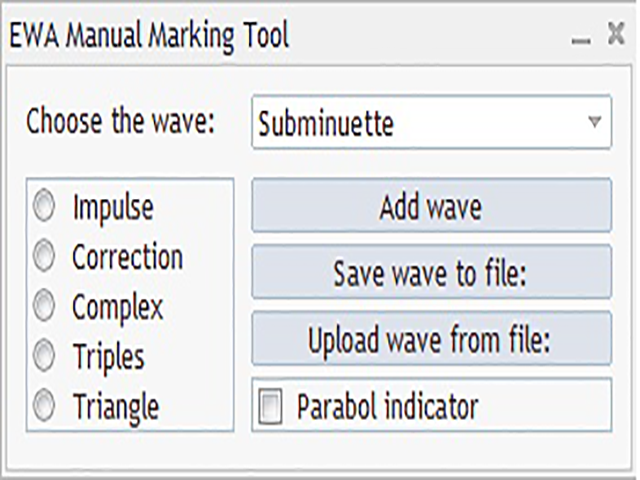
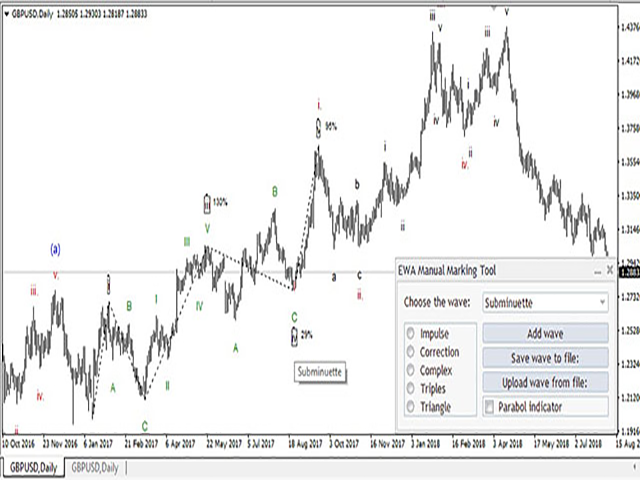
Para mayor simplicidad, el marcado de ondas le ofrece un indicador para marcar las ondas de Elliot. El usuario sólo tiene que seleccionar el nivel de onda, seleccionar el tipo de onda y añadir ondas haciendo clic en los vértices del gráfico.
Primero, seleccione el nivel de las ondas utilizando el ratón o los números del teclado 0..9.
Seleccione el tipo de onda con el ratón o Impulso (I - botón) 12345, Corrección (C - botón) ABC, Complejo (Y - botón) WXY, Triples (Z - botón) WXYXZ, Triángulo (T - botón) ABCDE.
Después de hacer clic en Añadir onda o Insertar, el programa está listo para empezar a marcar, después de hacer clic, puede colocar etiquetas en el gráfico.
Después de instalar las ondas, seleccionando la etiqueta de la onda, puede cambiar su propiedad cambiando sólo una etiqueta, las etiquetas de las ondas se pueden mover.
Al seleccionar las ondas y pulsar el botón L , muestra las líneas entre las ondas.
Al seleccionar las ondas y pulsar el botón K , se muestran los canales entre las ondas.
Al seleccionar las ondas y pulsar el botón [ o ], aumenta o disminuye el grado de las ondas.
Al pasar el ratón por la etiqueta de una onda , se muestra la relación porcentual de las ondas, a saber, la onda 3 con respecto a la onda 1, la onda 5 con respecto a la onda 3, y las ondas 2 y 4 con respecto a las ondas 1 y 3.
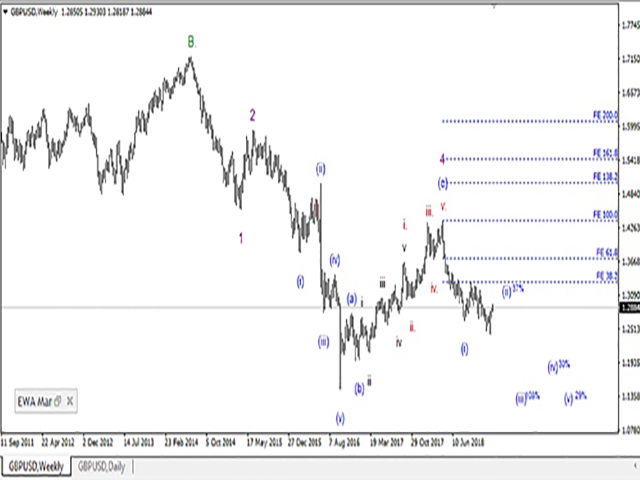
Al seleccionar las ondas y pulsar el botón F se proyectan los niveles de Fibo.
El botón ESC anula la selección de todos los objetos del gráfico.
El botón DELETE borra todos los objetos seleccionados en el gráfico.
Guardar onda en archivo - guarda la marca de onda del gráfico en un archivo y, si es necesario, se puede cargar en otro gráfico.
Cargar onda desde archivo - carga las ondas en el gráfico.
Indicador Parabol (Botón P) - El indicador calcula la regresión polinómica en un cierto número de barras, calcula la desviación estándar del precio de la línea de regresión en el mismo rango y con coeficientes de Fibonacci. El grado de regresión (RegressDegree) permite visualizar un canal hiperbólico. Canal de desviación lineal KNLDev, permite establecer el multiplicador a la desviación.
Cómo interpretarlo: Si el canal se dobla y cruza la tendencia alcista de arriba a abajo, es una señal de agotamiento de la tendencia, debemos esperar una corrección o un cambio de dirección. Con una tendencia bajista con exactamente lo contrario.
Estoy seguro de que el indicador acelerará a veces el trazado de la onda en el gráfico. También ayudará a no perderlo - guardándolo en un archivo.