Elliott WAVE Manual Marking Tool
- Indikatoren
- Version: 2.11
- Aktualisiert: 7 Oktober 2021
- Aktivierungen: 5
Die meisten Devisenhändler kennen das Elliott-Wellen-Analyse-System. Was also ist diese Wellenanalyse: Es handelt sich um die Untersuchung und Analyse des Preises und nicht seiner Derivate (verschiedene Indikatoren); die Fähigkeit, Kursziele mit Hilfe von Fibonacci-Tools zu bestimmen (Elliott-Wellen sind eng mit den Fibonacci-Zahlen verbunden). Mit EWA ist es möglich, ein Handelssystem mit einer klaren Beschreibung der Inputs und Outputs zu erstellen.
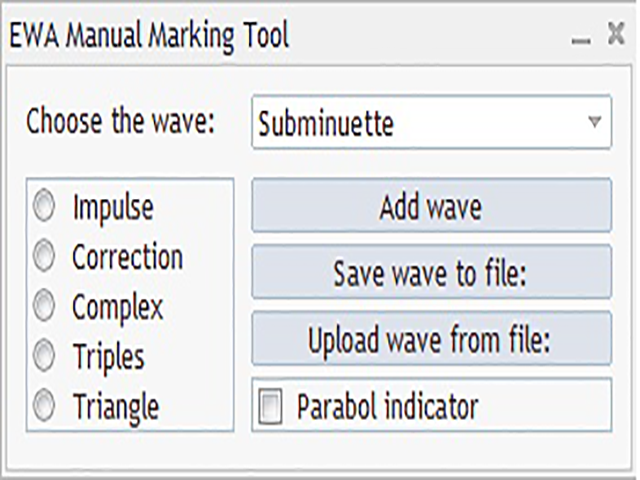
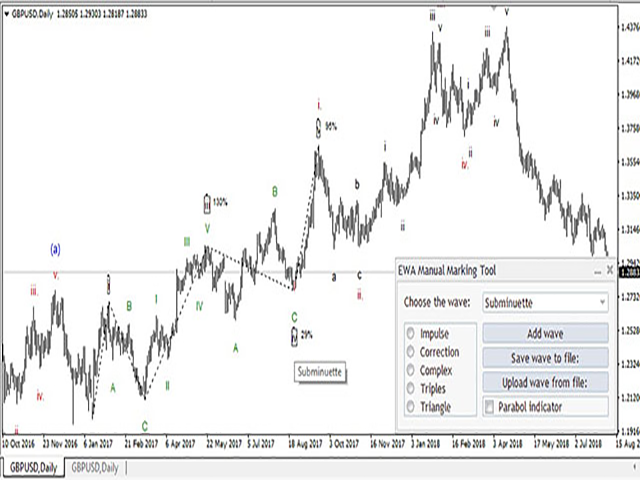
Der Einfachheit halber bietet Ihnen die Markierung der Wellen einen Indikator zur Markierung der Elliot-Wellen. Der Benutzer muss nur die Wellenebene und den Wellentyp auswählen und die Wellen durch Klicken auf die Eckpunkte des Diagramms hinzufügen.
Wählen Sie zunächst das Niveau der Wellen mit der Maus oder den Zahlen auf der Tastatur 0..9.
Wählen Sie den Wellentyp entweder mit der Maus oder mit Impuls (I - Taste) 12345, Korrektur (C - Taste) ABC, Komplex (Y - Taste) WXY, Dreifach (Z - Taste) WXYXZ, Dreieck (T - Taste) ABCDE.
Nachdem Sie auf Welle hinzufügen oder einfügen geklickt haben, ist das Programm bereit, mit der Markierung zu beginnen; nach dem Anklicken können Sie Etiketten auf dem Chart platzieren.
Nach der Installation der Wellen und der Auswahl der Wellenbeschriftung können Sie deren Eigenschaften ändern, indem Sie nur eine Beschriftung ändern, Wellenbeschriftungen können verschoben werden.
Wenn Sie die Wellen auswählen und die Taste L drücken, werden die Linien zwischen den Wellen angezeigt.
Wenn Sie die Wellen auswählen und die Taste K drücken, werden die Kanäle zwischen den Wellen angezeigt.
Wenn Sie die Wellen auswählen und die Taste [ oder ] drücken, erhöhen oder verringern Sie den Grad der Wellen.
Wenn Sie mit der Maus über eine Wellenbezeichnung fahren , wird das prozentuale Verhältnis der Wellen angezeigt, nämlich Welle 3 zu Welle 1, Welle 5 zu Welle 3, Welle 2 und 4 zu den Wellen 1 und 3.
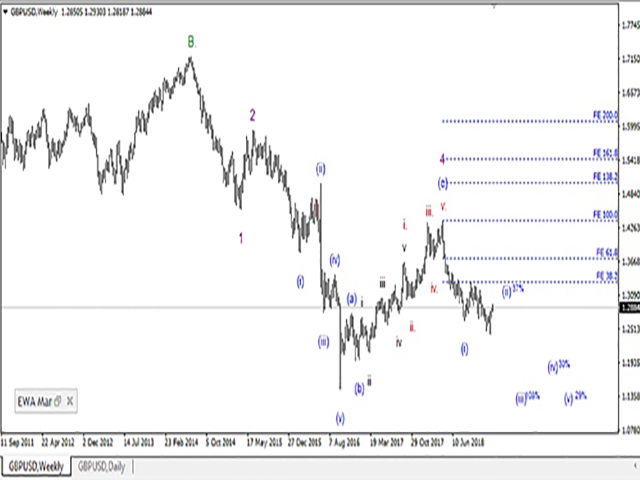
Wenn Sie die Wellen auswählen und die Taste F drücken, werden die Fibo-Ebenen projiziert.
Die ESC-Taste hebt die Auswahl aller Objekte im Diagramm auf.
Die Taste DELETE löscht alle ausgewählten Objekte im Diagramm.
Welle in Datei speichern - speichert die Wellenmarkierung des Diagramms in einer Datei und kann bei Bedarf in ein anderes Diagramm geladen werden.
Welle aus Datei hochladen - lädt die Wellen in das Diagramm hoch.
Parabol-Indikator (Schaltfläche P) - Der Indikator berechnet die polynomiale Regression auf einer bestimmten Anzahl von Balken, berechnet die Standardabweichung des Preises von der Regressionslinie auf dem gleichen Bereich und mit Fibonacci-Koeffizienten. Der Grad der Regression (RegressDegree) ermöglicht die Anzeige eines hyperbolischen Kanals. Der Kanal für die lineare Abweichung (KNLDev) ermöglicht es Ihnen, den Multiplikator für die Abweichung festzulegen.
Interpretation: Wenn der Kanal gekrümmt ist und den Aufwärtstrend von oben nach unten kreuzt, ist dies ein Signal für eine Erschöpfung des Trends, wir sollten eine Korrektur oder eine Richtungsänderung erwarten. Bei einem Abwärtstrend mit genau dem Gegenteil.
Ich bin mir sicher, dass der Indikator die Darstellung der Wellen auf dem Chart manchmal beschleunigen wird. Es wird auch helfen, ihn nicht zu verlieren - durch Speichern in einer Datei.