Verdure Woodie Pivot Trail
- Indicadores
- Versión: 2.0
- Actualizado: 24 marzo 2020
- Activaciones: 5

Vista general
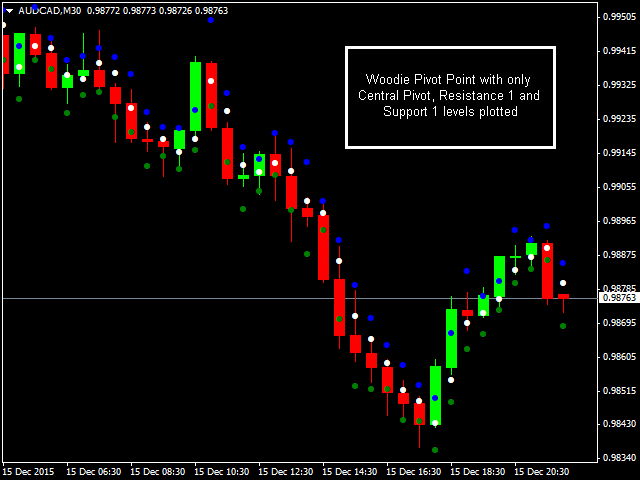
Esta es la versión WOODIE de la serie Verdure Pivot Trail. Verdure Woodie Pivot Trail traza niveles de pivote WOODIE para cada barra en el gráfico. Los niveles de pivote son excelentes para determinar los puntos de inflexión en el mercado y cuando los niveles de pivote del período se comparan con el nivel de pivote diario, estos giros pueden ser predichos con precisión y cronometrados.
Características
- Calcula y dibuja dinámicamente niveles Pivot para cada barra del gráfico (Punto Pivot Central, R1, R2, R3, S1, S2 y S3).
- El nivel de pivote se puede utilizar para seguir posiciones o para determinar puntos de inflexión en el mercado.
- Funciona en los 9 marcos temporales desde M1 hasta MN1.
- Los valores de periodos anteriores se guardan en el búfer y pueden visualizarse en la ventana de datos. Esto resulta especialmente útil si desea comprender cómo se comporta el precio en torno a los niveles de pivote.
- Opciones totalmente personalizables desde la pestaña INPUT de la ventana de propiedades del indicador.
- Puede configurarse para enviar un correo electrónico por cada periodo.
- Puede configurarse para enviar notificaciones por cada periodo al terminal móvil.
- Puede ser utilizado en EAs utilizando iCustom para obtener datos del buffer apropiado.
Ventajas
- Ahorra tiempo al no tener que volver a calcular manualmente los niveles de pivote...NUNCA más
- Hace uso de los datos de la plataforma de su broker para que no tenga que depender de los puntos pivote ya calculados de algunos sitios web en Internet cuyos datos pueden ser diferentes a los de su broker
- Totalmente personalizable, para que sólo muestre los niveles de pivote que utiliza en su estrategia. Por ejemplo, puede elegir mostrar sólo el Pivote Central, la Resistencia 1 y el Soporte 1. Esto es bastante útil en el sentido de que ayuda a mantener su gráfico limpio y ordenado. Puede elegir mostrar cualquier combinación de niveles de pivote.
- Se puede utilizar en todos los instrumentos en MetaTrader 4