Fibo Bands
- Indikatoren
- Version: 1.22
- Aktualisiert: 25 Juli 2024
- Aktivierungen: 7

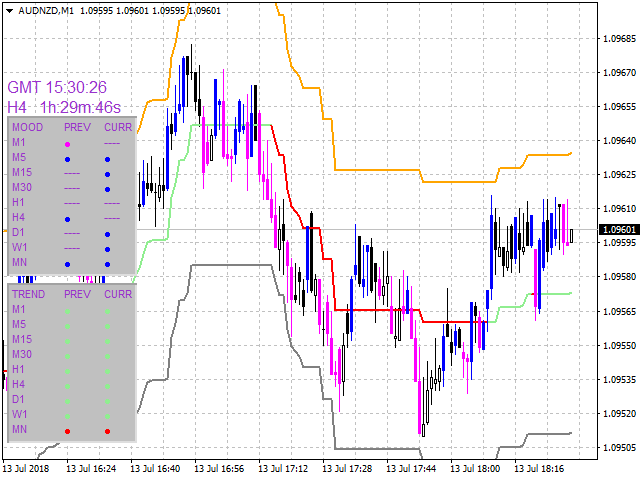
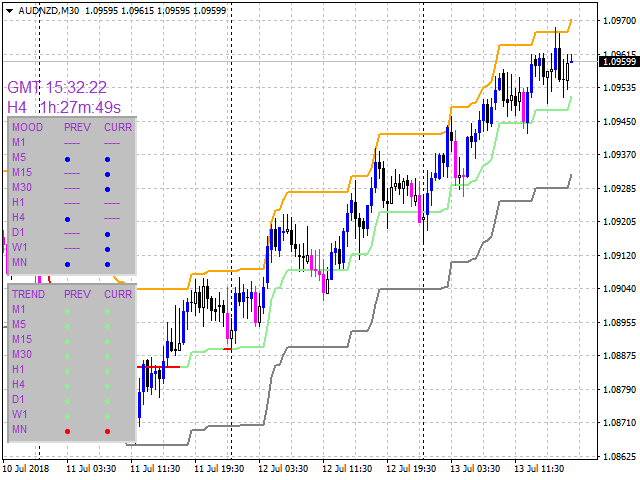
Fibo Bands ist ein innovativer Indikator und ein Analysator für den Handel in der aktuellen Trendrichtung. Der Indikator bildet einen Fibonacci-Kanal (Bänder), und besteht aus einer Trendlinie (Mittellinie), Kanalbändern, farbigen Balken und Referenzinformationen.
Nach Beendigung des aktuellen Balkens werden die Trendlinie, der Kanal und die Farbe des Balkens nicht neu gezeichnet. Die Kanalbreite kann jedoch nach einem Reset oder Neustart des Indikators je nach Volatilität geändert werden.
Der Kanal wird in Übereinstimmung mit der Fibonacci-Expansion gebildet, die für jeden Zeitrahmen individuell eingestellt werden kann. Die Kanalgrenzen können als Take-Profit-Ziel dienen.
Die Veränderung der Marktstimmung kann auf der Grundlage eines der vierzehn Basisindikatoren berechnet werden, die im Standardpaket von MT4 enthalten sind, und beeinflusst die Farbe der Trendlinie.
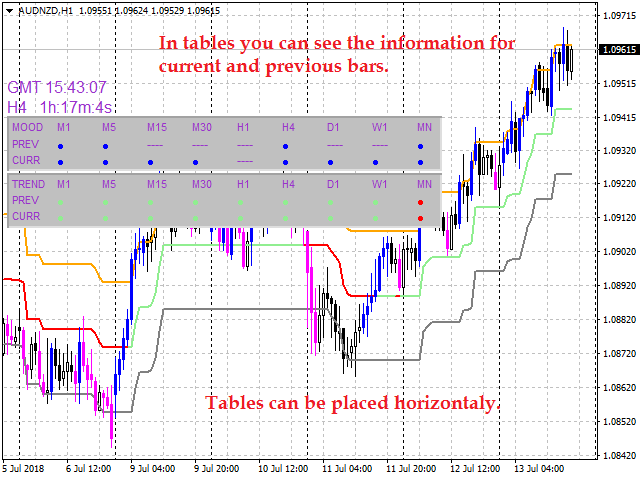
Die Referenztabellen enthalten Daten über die Farbe der Balken und die Mittellinie der letzten beiden Balken in allen Zeitrahmen. Die Farben der Balken und der Mittellinie charakterisieren die Stimmung des Marktes.
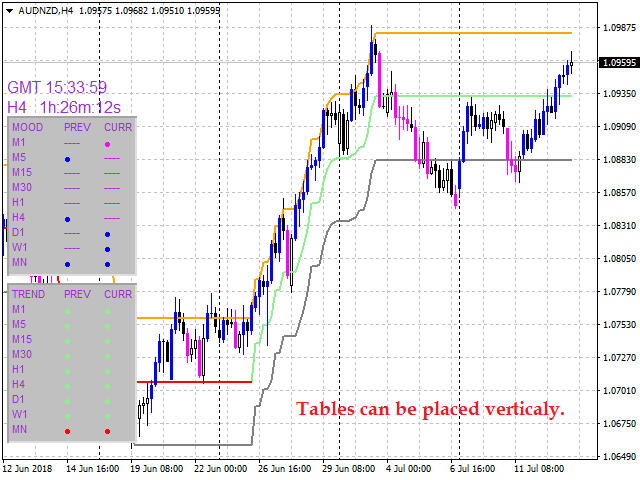
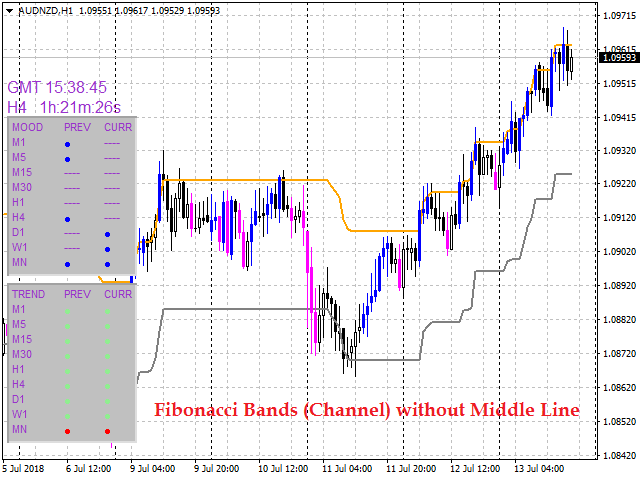
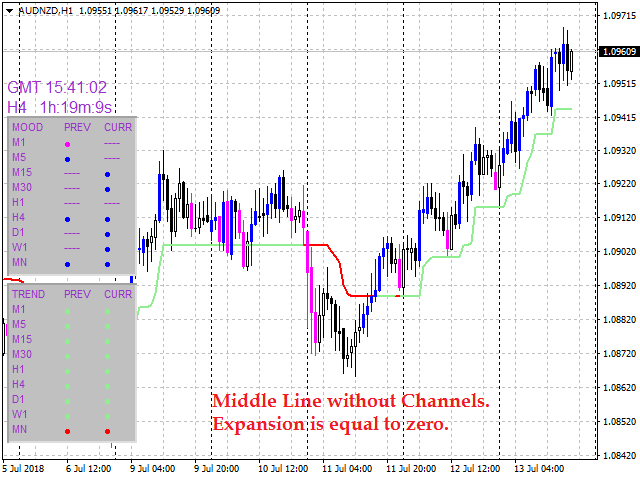
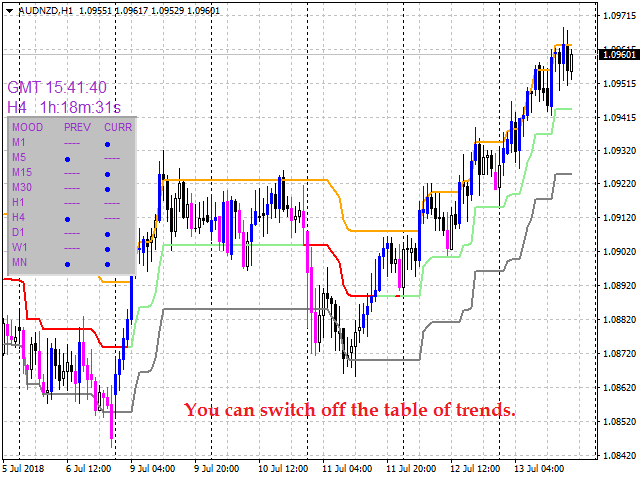
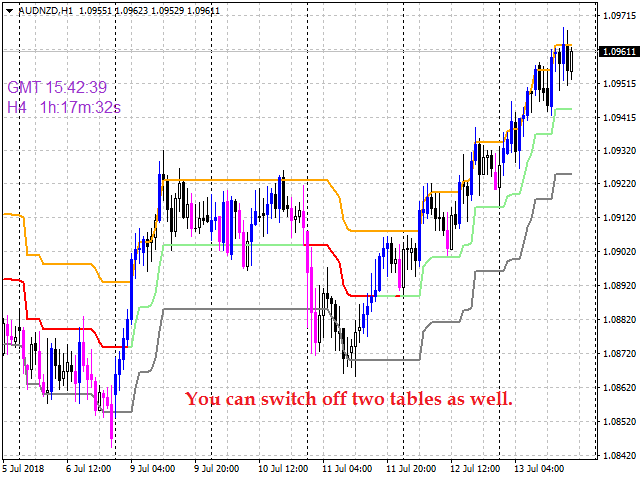
Optional können farbige Balken, Mittellinie, Bänder und Referenzinformationen auf dem Chart angezeigt oder ausgeblendet werden, wie in den Screenshots gezeigt.
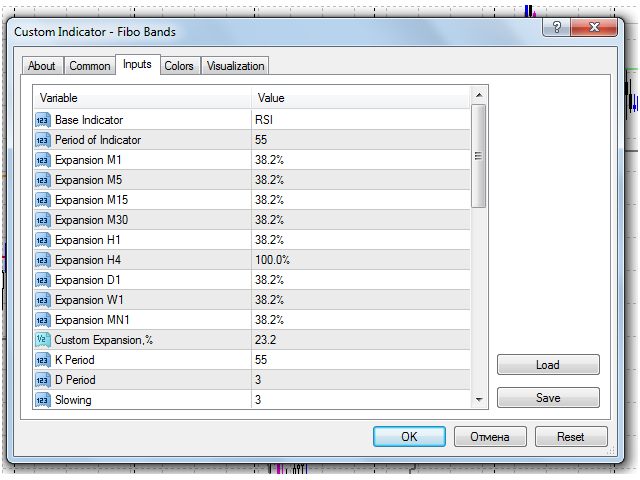
Eingabeparameter
- Basisindikator - der verwendete Basisindikator;
- Zeitraum des Indikators - Berechnungszeitraum für den Basisindikator;
- Ausdehnung M1... MN1 - Fibonacci-Expansionseinstellungen für verschiedene Zeitrahmen;
- Benutzerdefinierte Expansion,% - benutzerdefinierter Expansionswert;
- K-Periode - Stochastik-Parameter;
- D-Periode - Stochastik-Parameter;
- Verlangsamung - Stochastische Parameter;
- Stochastischer Preistyp - Stochastischer Berechnungspreis;
- Preisfeld - Mittelungsmethode für die Stochastik-Signallinie;
- MA Fast Period - Periode des schnellen gleitenden Durchschnitts für den Basisindikator;
- MA Slow Period - Periode des langsamen gleitenden Durchschnitts für den Basisindikator;
- MA Signalperiode - Periode der Signallinie für den Basisindikator;
- Angewandter Preis - Preis, der für die Berechnung des Basisindikators verwendet wird;
- MA-Methode - die Mittelungsmethode des gleitenden Durchschnitts des Basisindikators;
- Modus-Linie - der Linienindex des Basisindikators;
- Candlesticks Malerei - Färbung der Balken;
- Eckentyp - die Chartecke, in der Informationen angezeigt werden sollen;
- Corner X Distance - Koordinate der Tabelle entlang der X-Achse in Pixel;
- Corner Y Distance - Koordinate der Tabelle entlang der Y-Achse in Pixeln;
- Middle Line Drawing - Anzeige der mittleren Linie;
- GMT - zeigt den aktuellen GMT-Zeitwert an;
- Zeit des nächsten H4-Balkens - verbleibende Zeit bis zum Abschluss des H4-Balkens;
- Tabelle für Candlesticks Scanning - diese Tabelle scannt die Farbe der Balken;
- Tabelle für das Scannen der mittleren Linie - diese Tabelle scannt die Farben der mittleren Linie;
- Vertikale Tabelle - die Methode der Tabellenanzeige;
- Informationsfarbe - Farbe für die Informationen;
- Bullish Color of Candlesticks - Farbe der bullischen Balken;
- Bearish Color of Candlesticks - Farbe der bärischen Balken;
- Bullish Color of Middle Line - bärische Farbe für die Mittellinie;
- Bearish Color of Middle Line - bullische Farbe für die Mittellinie.
Zweck
Der Indikator kann für den manuellen oder automatisierten Handel innerhalb eines Expert Advisors verwendet werden. Werte von Indikatorpuffern des Typs Double können für den automatisierten Handel verwendet werden:
- Die mittlere Linie des Aufwärtstrends - Puffer 0;
- Die Mittellinie des Abwärtstrends - Puffer 1;
- Obere Kanalgrenze - Puffer 2;
- Untere Kanalgrenze - Puffer 3;
- Balkenfärbung - einer der Puffer 4, 5, 6 oder 7.
Die Indikatorpuffer dürfen nicht gleich EMPTY_VALUE sein.


Nice product if you learn how to use it. Congrats to author.