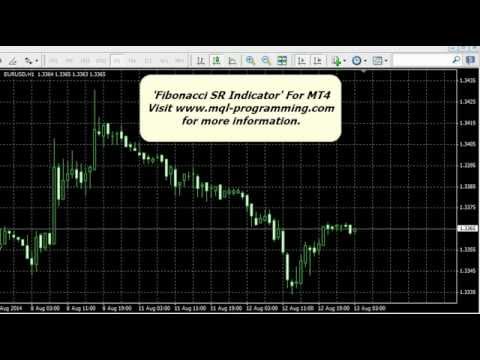
Fibonacci SR Indicator
- Indicadores
- Versión: 1.31
- Actualizado: 3 abril 2020

Fibonacci SR Indicator
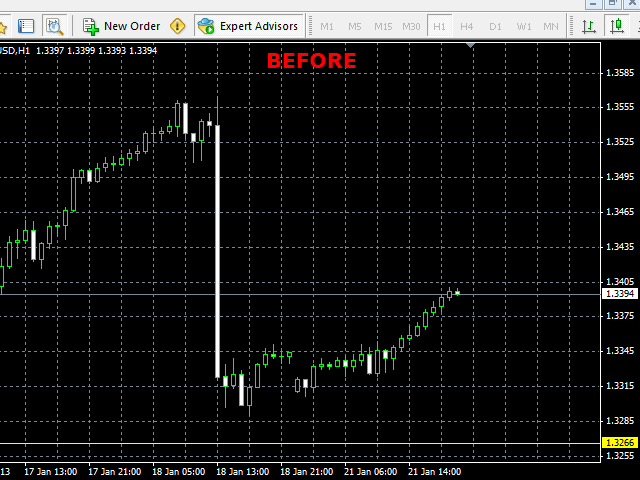
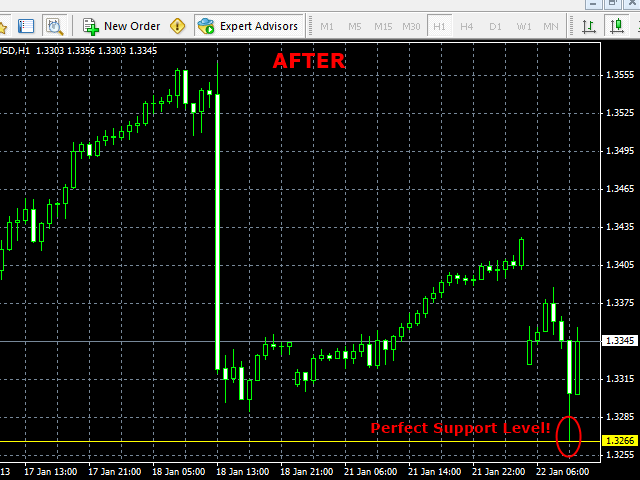
Este indicador dibuja las líneas de soporte y resistencia. El producto se basa en los niveles de retroceso y expansión de Fibonacci (Fibonacci Retracement and Extension levels). El indicador toma en consideración múltiples combinaciones de los niveles de Fibonacci y dibuja las líneas de soporte/resistencia. En sus cálculos el indicador utiliza los valores de las crestas y los valles construidos por el indicador ZigZag. Si hace falta, también se puede mostrar el ZigZag en el gráfico.
El indicador considera múltiples combinaciones de anteriores puntos de reversa y los niveles del coeficiente de Fibonacci. Cuando detecta la intersección de una importante cantidad de líneas sobre el mismo valor del precio, el indicador traza una línea de soporte/resistencia a través de este valor. La reversa del mercado suele ocurrir exactamente en estas líneas. El indicador trabaja automáticamente. Las líneas antiguas se eliminan, mientras que las nuevas se añaden en función del cambio de la situación en el mercado.
Ajustes
- Bars_Back - una determinada cantidad de barras completadas (back bars) que se utiliza en los cálculos. Cuanto más bajo sea el valor del parámetro, menos puntos de reversa serán utilizados y, por consecuencia, menos líneas de soporte y resistencia serán mostradas en el gráfico. Cuanto más alto sea el valor del parámetro, más puntos de reversa y líneas de soporte y resistencia habrá.
- Buffer_Space - número máximo de puntos entre cada nivel de Fibonacci calculado que es necesario para la intersección. Cuanto más alto sea el valor de este parámetro, la precisión del nivel de intersección será menor. Cuanto más bajo sea el valor de este parámetro, la precisión del nivel de intersección y la seguridad será mayor. Supongamos que el valor del parámetro es de 10 puntos y el indicador trabajo en la cuenta del broker que facilita los datos de precios indivisibles con cuatro dígitos decimales. El indicador detecta 3 niveles de retrocesos de Fibonacci sobre los valores 1,4995, 1,5000 y 1,5005. En este caso la diferencia es de 10 pips. De esta manera, estos niveles pueden ser utilizados. Supongamos que el valor del búfer está en 5. En este caso los datos del 3-r nivel no se puede utilizar porque la diferencia máxima es de 10. El indicador seguirá buscando otras combinaciones.
- Count_of_Lines - número de líneas que se utilizan para formar la línea final de soporte/resistencia. Cuanto más alto sea el valor de este parámetro, más seguras serán las líneas trazadas, y al revés.
Otros ajustes no requieren explicaciones.


Отличный продукт!