Chart CCI 5
- Indicadores
- Versión: 4.2
- Actualizado: 20 noviembre 2021
- Activaciones: 5

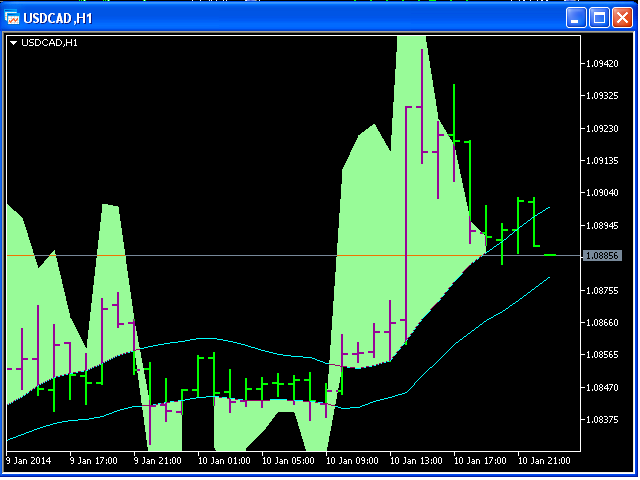
Este indicador es una combinación de 2 indicadores clásicos: MA y CCI.
Dos medias móviles forman las bandas superior e inferior.
El parámetro de entrada nPeriod se utiliza para los cálculos de MA y CCI.
Las nubes de color verde pálido caracterizan las tendencias al alza y a la baja. El momento en que una nube aparece por encima o por debajo del límite superior o inferior es el momento de entrar en el mercado.