Support Resistance Tunnel
- Indicadores
- Versión: 2.5
- Activaciones: 5

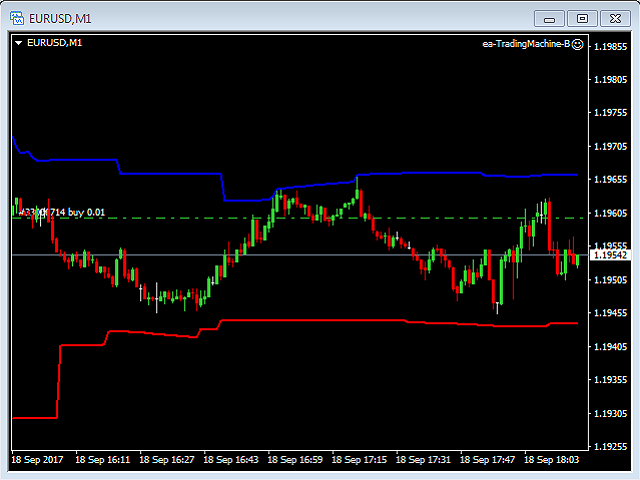
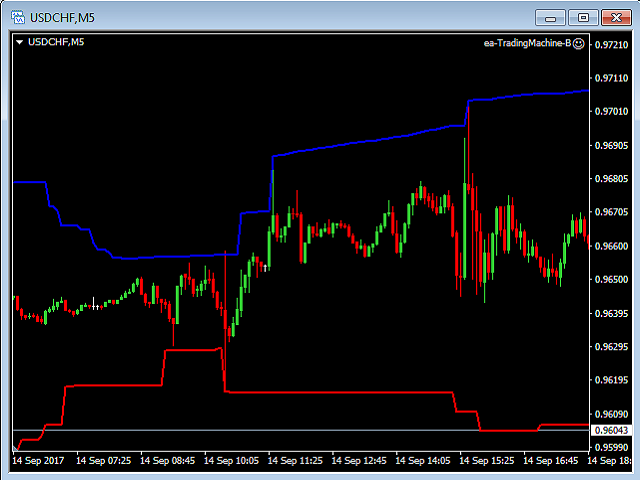
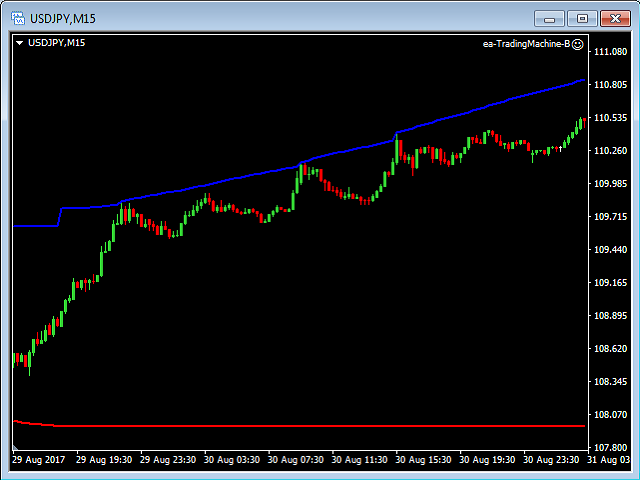
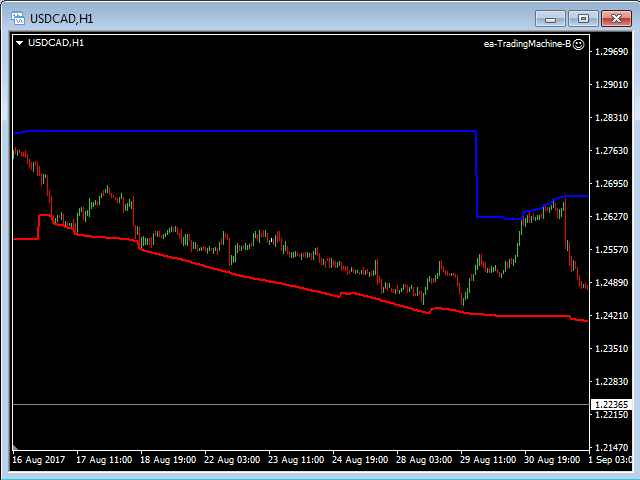
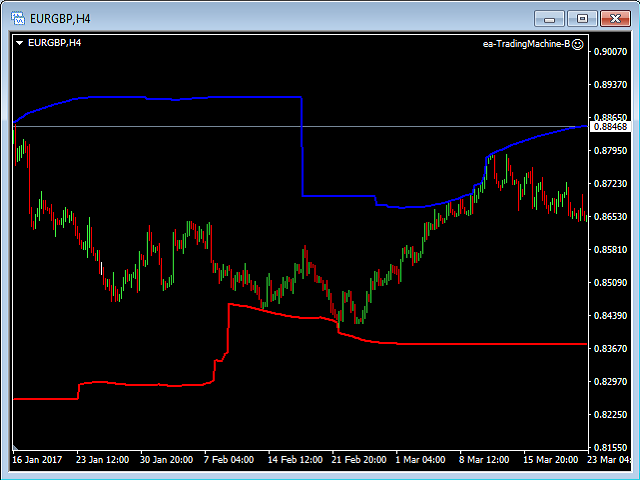
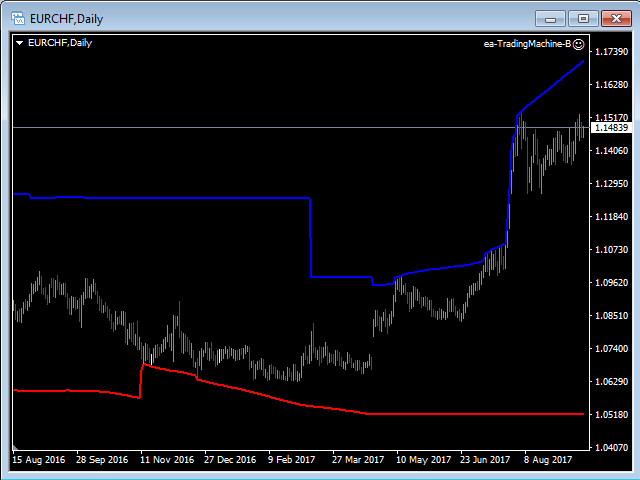
El precio se mueve entre dos líneas de túnel curvas en una tendencia. Las dos líneas de un túnel representan el soporte y la resistencia.
En una tendencia alcista, por ejemplo, se podría entrar en una operación en el soporte de la línea de tendencia (mostrado por la línea roja en el gráfico) y salir en la resistencia de la línea superior del túnel (mostrada por la línea azul). El túnel muestra la dirección de la tendencia para cualquier marco temporal (si tiene suficientes barras en el gráfico para marcos temporales superiores).
La tendencia, o túnel de precios, puede ser alcista, bajista o lateral. Si el precio actual está más cerca de la línea roja, entonces la línea azul será horizontal. Esta situación muestra (definitivamente) que tenemos una tendencia bajista. Si el precio actual está más cerca de la línea azul, la línea roja será horizontal. Esta situación muestra (con toda seguridad) que tenemos una tendencia alcista. Si dos líneas indicadoras están disminuyendo la altura de un túnel y ambas líneas son paralelas entre sí, entonces tenemos una tendencia lateral.
Entradas
- BarsShow - cuantas barras en el gráfico este indicador mostrará las líneas del túnel (comenzando desde la barra actual hacia atrás).
Nota: Usted debe tener una historia de datos en el gráfico, que está utilizando el doble de tiempo como su parámetro de entrada BarsShow.