X Trend Pluss
- Indicadores
- Versão: 1.0
- Ativações: 5

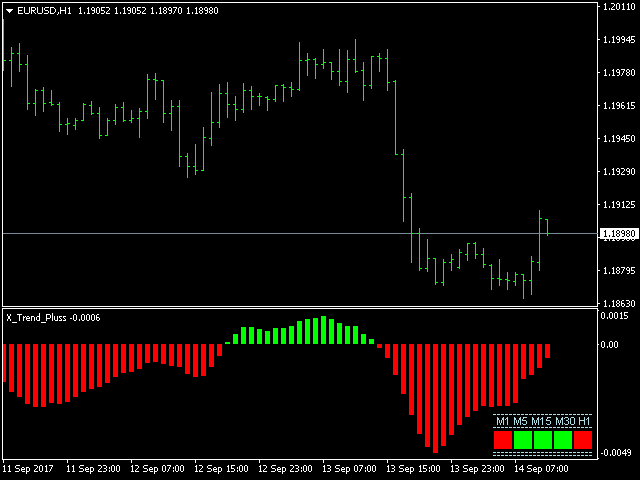
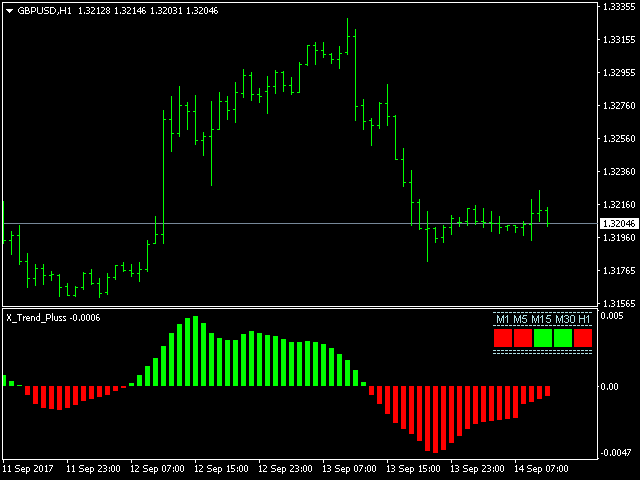
This indicator displays the trend movements.
Parameters
- Trend: Displays the trend movements, true/false.
- X: moves the trend left and right.
- Y: moves the trend up and down.
How to understand the status:
- (M1), square indicates the timeframe for 1 minute. If the square is green, trend is up. If the square is red, trend is down.
- (M5), square indicates the timeframe for 5 minute. If the square is green, trend is up. If the square is red, trend is down.
- (M15), square indicates the timeframe for 15 minute. If the square is green, trend is up. If the square is red, trend is down.
- (M30), square indicates the timeframe for 30 minute. If the square is green, trend is up. If the square is red, trend is down.
- (H1), square indicates the timeframe for 1 hour. If the square is green, trend is up. If the square is red, trend is down.
If the indicator bar is green, trend is up. If the indicator bar is red, trend is down.