Radar of Probability
- Indicadores
- Versión: 3.8
- Activaciones: 5

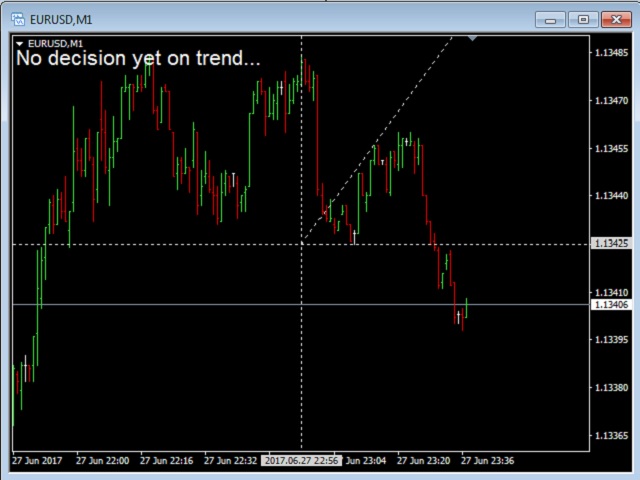
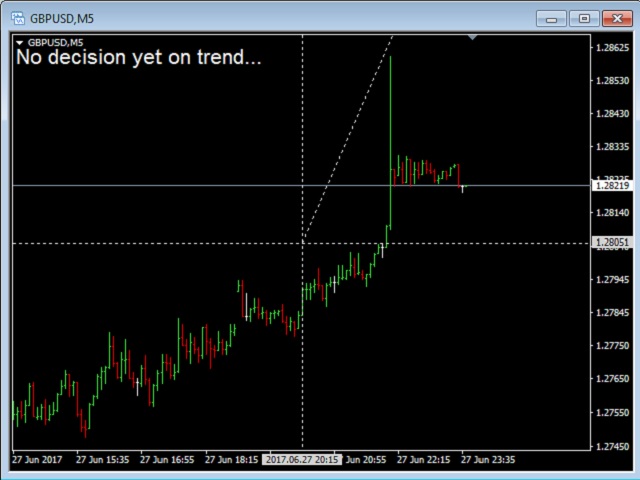
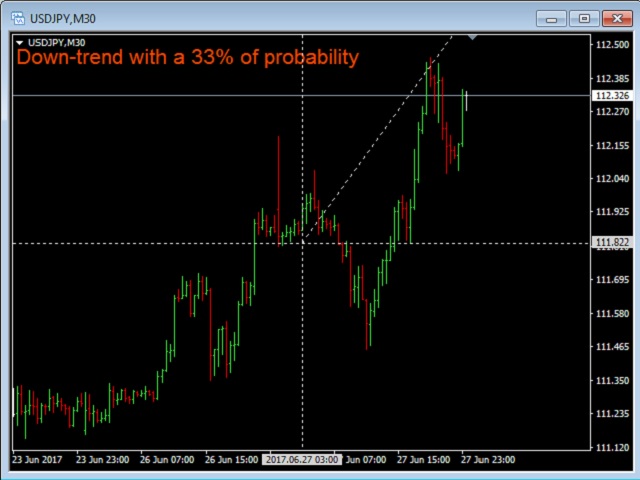
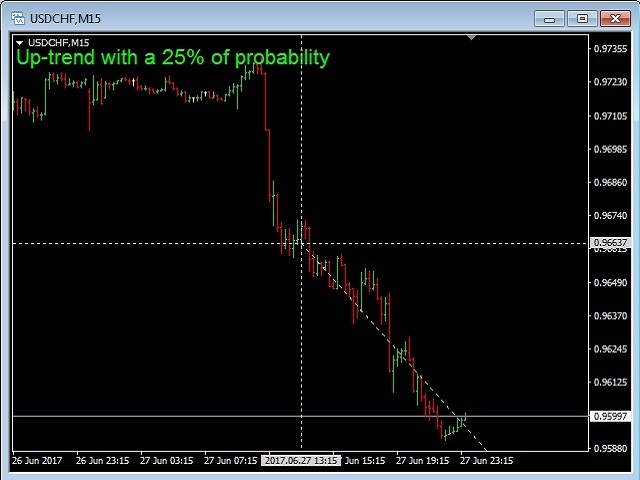
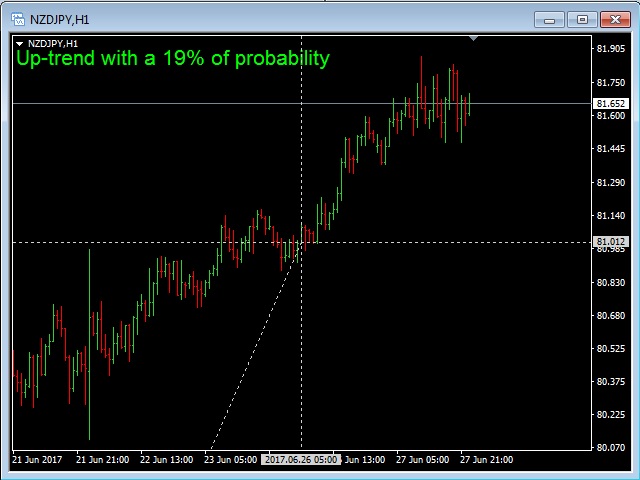
Este indicador calcula constantemente la probabilidad de una tendencia. El resultado de esos cálculos se muestra en la esquina superior izquierda del gráfico. Se muestra en un texto de color verde si la tendencia se espera que vaya hacia arriba, en un texto de color rojo si la tendencia está gastando para ir hacia abajo, y en un texto en blanco si "no hay tendencia" se calcula.
Puede mostrar líneas cruzadas en el color de su elección o puede eliminar esas líneas cruzadas estableciendo el color de la Cruz a "Ninguno". Este indicador puede mostrar un vector radar en el color de su elección o puede eliminar esos vectores estableciendo el color Radar en "Ninguno".
Por supuesto, la duración de una tendencia depende completamente del marco temporal. Por lo tanto, para el M1 TF puede esperar los resultados correctos para el próximo par de minutos, para H1 TF - para el próximo par de horas, etc.
Parámetros de entrada
- Radar = clrLightGray - color de la línea vectorial;
- Cross = clrLightGray - color de las líneas cruzadas;
- clrUp = clrLime - color del texto de la tendencia alcista;
- clrDn = clrOrangeRed - color del texto de la tendencia bajista;
- clrNull = clrWhite - color del mensaje de texto "Aún no hay decisión sobre la tendencia...";
- Font_Size = 16 - tamaño de la fuente;
- Chart_Shift = true/false - activar/desactivar el desplazamiento del gráfico;