Aggression Wave RSJ
- Indicadores
-
JETINVEST
 Roberto Junqueira, is Trader for over 20 years and has been developing indicators and trading experts for more than 10 years for the Forex, Cryptocurrencies and Stock Exchanges markets.
 - Versión: 5.10
- Actualizado: 7 junio 2021
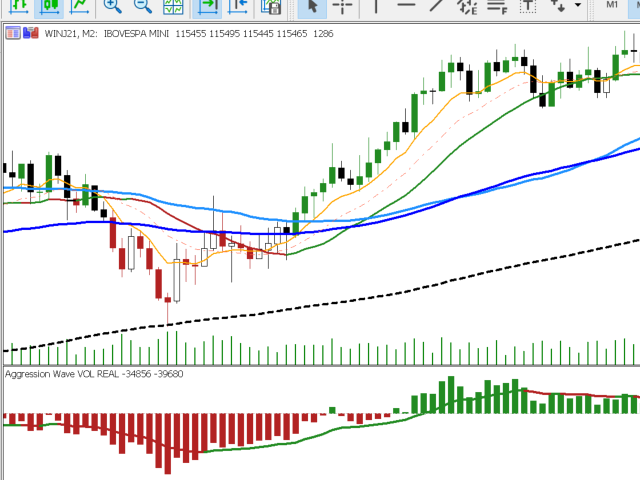
Este indicador suma la diferencia entre la agresión vendedora y la agresión compradora ocurridas en cada Vela, graficando las ondas de acumulación de los volúmenes de agresión, a través de las cuales se calcula una media exponencial que indica la dirección del flujo de negocios.
Nota: Este indicador NO FUNCIONA para Brokers y/o Mercados SIN el tipo de agresión (COMPRA o VENTA).
No deje de probar nuestra versión Profesional con características configurables y alertas: Agression Wave PRO
Configuración
- Agresión por volumen (Volumen Real) o por número de operaciones (Tick Volumen)
- Inicio del cálculo del Delta de Agresión:
- Últimos dos días
- Última semana
- Último mes
- Últimos 6 meses
Notas
- Cuanto más corto sea el tiempo del gráfico, más tiempo tendrá el indicador para empezar a procesar los datos actuales, ya que estará calculando todas las velas pasadas.
- Cuanto más alejada de la fecha actual esté la configuración de inicio, más tiempo tardará el indicador en empezar a procesar los datos actuales, ya que estará calculando todas las velas pasadas.
Si todavía tiene preguntas, por favor póngase en contacto conmigo por mensaje directo: https: //www.mql5.com/en/users/robsjunqueira/


Muito bom