Market Pressure

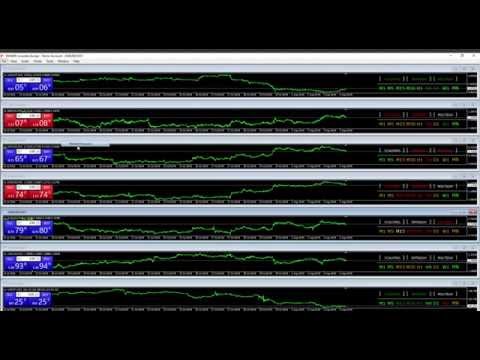
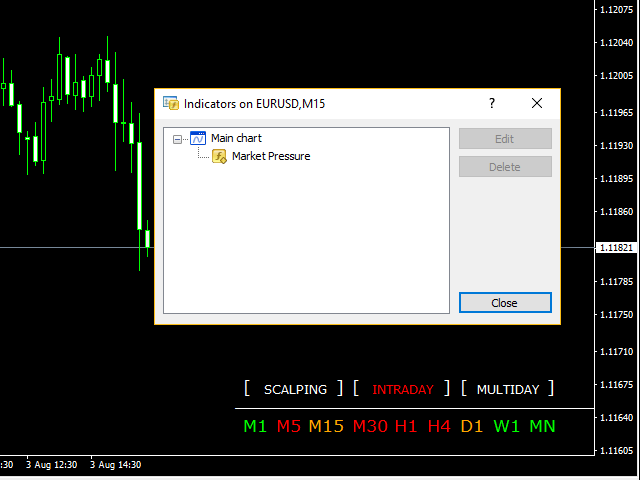
Market Pressure is a next-generation display.

Its simple and intuitive graphics system allows you to receive directions very easy and fast.

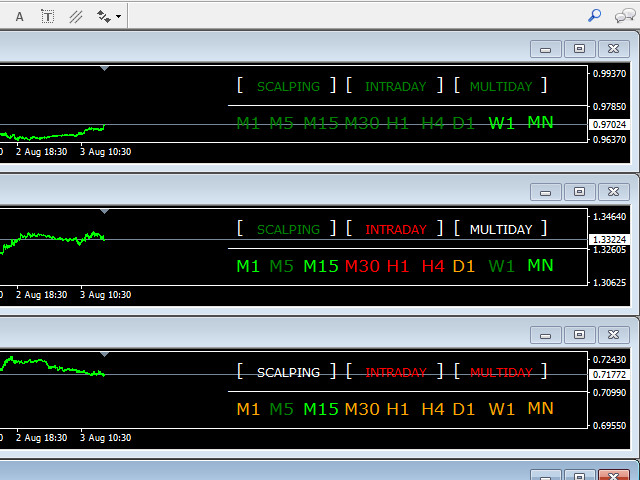
This indicator can give three different methods of signals: Scalping, Intraday and Multiday.

The logic is based on the price action which combined on multiple time frame. It can give very high quality signals.

An indispensable tool for those who want to understand the market pressure and the operating trend.

The indicator is customizable for both colors for the font size, we still recommend not to change our parameters as optimized to return excellent graphic result.
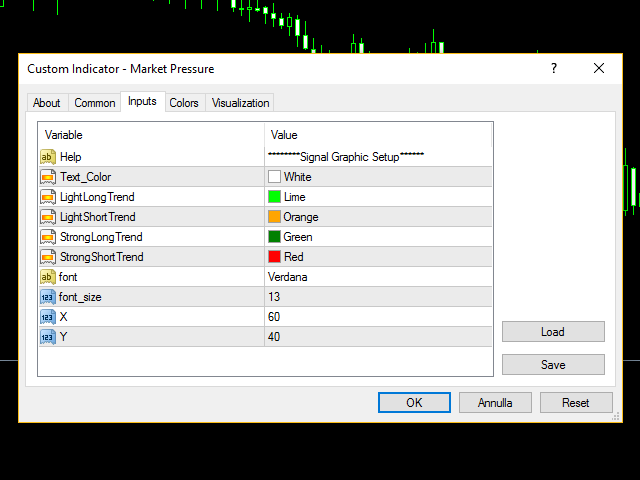

Input Values

Signal Graphic Setup

  • Text_Color (parenthesis and row color)
  • LightLongTrend (weak LONG signal on TF)
  • LightShortTrend (weak SHORT signal on TF)
  • StrongLongTrend (strong LONG signal on TF)
  • StrongShortTrend (strong SHORT signal on TF)
  • font = "Verdana" (changeable)
  • font_size (changeable)
  • X (position of panel)
  • Y (position of panel)
Produtos recomendados
Pyro Trend
Oleksii Ferbei
Pyro Trend is a new product that allows you to identify the current market phase (uptrend, downtrend or flat). The indicator is applicable for any data and periods. The middle of the trend wave, as well as the edges, are places of special heat and market behavior; when writing the indicator, an attempt was made to implement precisely finding the middle. Pyro Trend is a trend indicator that uses an original calculation algorithm. This indicator paints arrows in different colors depending on the
Dublgis
Ivan Simonika
Here is a sensitive indicator for Dublgis professionals. It is built on completely new algorithms and is more efficient, on any timeframes, since it filters random price movements. Finds and visually displays price reversal points. This tool can be used as confirmation when making a deal, as well as to determine the direction of the trend and its strength. The indicator was developed as a complement to a number of our other trading tools.
This product shows you a different view of the market by examining the performance of volume and continuous patterns in the market, then by calculating the behavior of traders and market patterns, calculates the probability of the next movement of the market by calculations. Function. How to receive the signal: If the candlestick is currently a bullish candlestick, according to a market scan, if the next bullish candlestick is below 5%, you can open a free trade by hitting the wisdom areas.
Implement
Vitalii Zakharuk
5 (1)
Implement analyzes market dynamics for pivot points. If you want to learn how to spot the correct reversals for consistently likely profitable trading, buy this indicator. Shows favorable moments of entering the market in stripes. Ready-made trading system. The principle of operation of the indicator is to automatically determine the current state of the market when placed on a chart, analyze historical data based on historical data and display instructions for further actions on the trader's
PTW NON REPAINT TRADING SYSTEM + HISTOGRAM Non-Repainting ,   Non-Redrawing   and   Non-Lagging  Trading System. Does the following: - Gives Accurate Entry and Exit Points - Scalping, Day and Swing Trading  - 95% Accuracy  - Targets, where to take profits. - Shows Trends, Support and resistance levels - Works on All Brokers - Works on All Currencies, CFDs and Stocks - It does not place trades for you, it only shows you what trades to place. - It works on All Timeframes - It is for Trend or ran
RegLin Polinómico – Bandas de Regressão Polinomial com Filtros Inteligentes RegLin Polinómico é um indicador profissional que ajusta um polinômio (grau 1 , 2 ou 3 ) sobre uma janela móvel de preços e constrói bandas dinâmicas a partir do desvio-padrão dos resíduos do ajuste. Inclui RSI (com timeframe selecionável) e a opção “apenas em tendência” para filtrar rompimentos de baixa qualidade. Também permite ativar/desativar som ao gerar sinais visuais (setas). Como funciona Ajusta um polinômio de g
Market Profile
Artem Titarenko
5 (1)
The "Market Profile" indicator displays the profiles and volumes of periods – weekly, daily, session (8-hour), 4-hour, hour, summary. The VAH/VAL price area is automatically highlighted by a dotted line for each profile (except for the summary). The indicator includes chroma Delta, which colors the profile areas. The areas of prevailing Buys is colored in green, that of Sells - in red. The intensity histogram features blue/red respectively. In the filter mode, the indicator displays the volume a
Este indicador é um indicador para análise automática de ondas que é perfeito para negociações práticas! Caso... Nota:   Não estou acostumado a usar nomes ocidentais para classificação de ondas. Devido à influência da convenção de nomenclatura de Tang Lun (Tang Zhong Shuo Zen), nomeei a onda básica como   uma caneta   e a banda de onda secundária como   um segmento   . ao mesmo tempo, o segmento tem a direção da tendência.   O segmento de tendência principal   é nomeado (esse método de nomencl
The Momentum Standard/Hidden Divergence indicator will plot the momentum, and will also identify and plot standard (regular) divergences between the indicator and the price action, OR it can be set to identify and plot hidden (reverse) divergences between the indicator and the price action. The divergences themselves are implemented as lines (default green for bullish divergence and red for bearish divergence) drawn in the indicator pane. If activated via the Inputs dialog, alerts will be genera
Everyday trading represents a battle of buyers ("Bulls") pushing prices up and sellers ("Bears") pushing prices down. Depending on what party scores off, the day will end with a price that is higher or lower than that of the previous day. Intermediate results, first of all the highest and lowest price, allow to judge about how the battle was developing during the day. It is very important to be able to estimate the Bears Power balance since changes in this balance initially signalize about possi
O Indicador de Quadrados de Gann é uma poderosa ferramenta de análise de mercado baseada no artigo "Fórmula Matemática para Previsões de Mercado" escrito por W.D. Gann, que se baseia em conceitos matemáticos para análise. Ele incorpora elementos das técnicas de Gann relacionadas com os quadrados de 144, 90 e 52, bem como o quadrado de 9. Além disso, inclui o método do  sobre como combinar o quadrado de 9 com canais e padrões de estrela. Manual do Usuário e Modo de Uso: Antes de usar este indicad
Este filtro é baseado em polinômios de Bessel. Sua principal vantagem é um pequeno atraso de tempo. Outra característica desse filtro é sua alta sensibilidade aos valores mais recentes da série temporal financeira. Por causa disso, o indicador destaca os movimentos de preços ativos, enquanto suaviza os desvios de ruído. Além da variante clássica, os logaritmos dos coeficientes de Bessel foram adicionados ao indicador como função de ponderação. Nesse caso, o indicador acaba sendo mais suave, mas
Snake NW
Sergei Shishaev
5 (1)
Канальный индикатор "Snake" . Отлично показывает точки входа и выхода. Не перерисовывает! Хорошо подойдет для стратегий с сетками (усреднения), стратегий с пирамидами (стратегий добора), обычной торговли по тренду, торговли на коррекции. Для любых типов инструментов:   валюты, нефть, металлы, криптовалюты. Для любых таймфреймов:   от M1 до D1 . Для любых стилей торговли:   скальпинг, интрадэй, свинг, долгосрок . Используйте в сочетании с трендовым индикатором, чтобы исключить риски входа про
VWAP indicator for MT4
Renaud Herve Francois Candel
Moving VWAP Indicator Moving VWAP is an important indicator drawing the Volume-Weighted Average Price (VWAP). The VWAP is a reference used by institutional traders and acts as a level of support / resistance. If price is above VWAP then means market is bullish. If price is below VWAP then means market is bearish. It can be used to enter in the market with low risk (near VWAP) and also identify the correct direction of the market. The Moving VWAP is as simple as a Simple Moving Average. The m
WARNING:    This indicator is powerful, very high probability, not based on publically available algorithms. It's a matrix of 10 different entries, from 10 other pairs, determined by a machine learning algorithm and wave analysis (Fourier Series) over 2 years. it can detect major buy and sell signals, as well as trendless, narrow range, hours on the 30minute and H1 chart (for scalping strategies during the usually trendless Asian session), scalping breakout risk is eliminated. It tells you if E
Introduction to Fractal Pattern Scanner Fractal Indicator refers to the technical indicator that makes use of the fractal geometry found in the financial market. Fractal Pattern Scanner is the advanced Fractal Indicator that brings the latest trading technology after the extensive research and development work in the fractal geometry in the financial market. The most important feature in Fractal Pattern Scanner is the ability to measure the turning point probability as well as the trend probabi
Super volumes
Yerzhan Satov
4 (1)
O indicador de seta para Forex e Opções Binárias é criado com base nos volumes de ticks. Ao contrário de muitos indicadores, o indicador "Super volumes" calcula volumes de alta e baixa e emite sinais sobre a predominância de qualquer um deles. Se digamos que, no momento, nesse intervalo, havia uma vantagem de volumes de alta, então o sinal estará em Buy. Ou se a predominância foi de volumes de baixa, então, respectivamente, o sinal será Sell. Nas configurações do indicador, na variável "volume
Garuda Empire
Ellan Dirgantara Tholkhah
The Garuda Empire - Binary Options Experience the epitome of trading synthesis where the time-honored Ichimoku methodology seamlessly intertwines with revered Western indicators. It's a harmonious blend—Europe shaking hands with Japan, a true testament to the power of global financial collaboration. With years of dedicated observation and analysis, I've come to one conclusion: Mastery is achieved through specialization. My journey with the EURJPY has been transformative, leading to the birth of
**Volume Trend Navigator** is a modern volume-based trend indicator that spots when market momentum is accelerating or fading by analyzing volume and recent price swings over three bars: * **Bullish acceleration**: Draws an ↑ arrow when the current bar’s volume exceeds that of the two preceding bars **and** price closes above the previous bar’s high—signaling a strengthened up-trend. * **Bearish acceleration**: Draws a ↓ arrow when the current bar’s volume exceeds that of the two preceding bar
Indi RBO
Syarief Azman Bin Rosli
Input: Range Start Time : The starting time of the range creation Range End Time : The ending time of range creation Trade End Time : The time where the line of range zone high/low will be extended to Minimum Size : The minimum size of the range in point Maximum Size : The maximum size of the range in point If the range size is between the minimum and maximum, indicator will print the 1st color (blue).
No Repaint Bext is a ready-made trading system. Shows when to open and when to close trades, as well as in which direction. Every time a green arrow appears, you need to open a buy trade. Close all buy trades when a red arrow appears. The same goes for the opposite direction, every time a red arrow appears, open sell trades and close them all when a green arrow appears. We use the M5 timeframe for trading. You can trade on any cozy pair. This indicator does not repaint and practically does not
Bank Expert
James D Blanks
Bank Expert Indicator Uses A Simple method of tracking price as it moves across the chart and signals when a potential long or short position is active and indicates this to the trader giving you the opportunity to take a position on the market. Or you can simply use this indicator to give yourself signals and determine if you want to take the trade or learn the strategy on your own. The Signals From this indicator are targeted at long-term positions and focus on top quality call outs. 
HTF Power of Three (ICT) -  MT4 Indicator Overview The   HTF Power of Three   indicator is a professional implementation of the Inner Circle Trader's (ICT) Power of Three concept, inspired by Larry Williams. This indicator visualizes higher timeframe (HTF) candle development in real-time on any lower timeframe chart, making it an essential tool for ICT traders who study institutional price movement patterns. What is Power of Three (PO3)? Power of Three represents a three-staged Smart Money campa
Trend New
Vitalii Zakharuk
Trend New Trend Indicator, shows the signals for entry. Displays both entry points and the trend itself. Shows statistically calculated moments for entering the market with arrows. When using the indicator, it is possible to optimally distribute the risk factor. Settings: Uses all one parameter for settings. Selecting a parameter, it is necessary to visually resemble it so that the appropriate graph has a projection of extremes. Options: Length - the number of bars for calculating the indica
Delta AG
Yurij Kozhevnikov
The difference between the arithmetic and geometric means at the specified range. Since the greater is the difference between the values, the greater the resulting figure is, actually the indicator shows volatility fluctuations. The arithmetic mean of a certain number of values ​​is the sum of the values ​​divided by their number. The geometric mean is the root of the power of the number of values ​​extracted from the product of these values. If all values ​​are equal, the arithmetic mean and th
Gioteen Volatility Index (GVI)   - your ultimate solution to overcoming market unpredictability and maximizing trading opportunities. This revolutionary indicator helps you in lowering your losing trades due to choppy market movements. The GVI is designed to measure market volatility, providing you with valuable insights to identify the most favorable trading prospects. Its intuitive interface consists of a dynamic red line representing the volatility index, accompanied by blue line that indicat
This is an indicator that helps you to scan the whole timeframe then informs you about the last candle position Engulfing Candlestick pattern was formed. The indicator also send alert to your mobile when a new engulfing candle is formed.  For the visual; 1. Green up arrow indicates a bullish engulfing candlestick pattern  2. Red down arrow indicates a bearish engulfing candlestick pattern
FREE
Um indicador técnico que estrutura gráficos e identifica movimentos cíclicos de preços. Pode funcionar em qualquer gráfico. Vários tipos de notificações. Existem setas adicionais no próprio gráfico. Sem redesenhar a história, trabalha no fecho da vela. TF recomendado a partir de M5 e superior. Parâmetros fáceis de utilizar e configurar. Ao utilizar 2 indicadores com parâmetros diferentes, pode utilizá-los sem outros indicadores. Tem 2 parâmetros de entrada Ciclicidade e duração do sinal Estes
Trend Pulse One
Adolfina Denysenko
Trend Pulse One is a new generation indicator based on an improved version of Parabolic SAR, supplemented with arrow signals. Its purpose is to simplify the process of trend analysis and provide the trader with clear, visually understandable entry and exit points. The main difference from the standard SAR is that Trend Pulse supplements the SAR lines with arrows that signal a change in trend direction. This makes the indicator convenient for visual analysis and application in real trading.
TrendRange
Olalekan Gisanrin
TrendRange   Indicator works on M1, M5, M15, M30, H1 and H4 timeframes. It indicates real market trend, support and resistance levels. In other words, it confirms trade directions. Scalpers especially,   Intraday, swing, intermediate and  long term traders will especially find this indicator useful. It uses customized show/hide buttons namely: "DRAW", "HILO", and "LEVEL" lines crossings and histograms ("AWOS" for Awesome Oscillator, "BUBE" for Bull Power and Bear Power & "GATO" for Gator Oscilla
Os compradores deste produto também adquirem
Indicador Miraculous – Ferramenta 100% Não Repintável para Forex e Opções Binárias Baseada no Quadrado de Nove de Gann Este vídeo apresenta o Indicador Miraculous , uma ferramenta de negociação altamente precisa e poderosa, desenvolvida especificamente para traders de Forex e Opções Binárias . O que torna este indicador único é a sua base no lendário Quadrado de Nove de Gann e na Lei da Vibração de Gann , tornando-o uma das ferramentas de previsão mais precisas disponíveis na negociação moderna.
Smc Blast Signal
Mohit Dhariwal
5 (4)
NEW YEAR 2026 SALE OFFER PRICE AT JUST 80 DOLLARS FEW COPIES ONLY AT This price From 5th Jan -10th Jan MIDNIGHT Final offer GRAB YOUR COPY ON THIS New Year EVE Prices will be increased to 150 after the offer period ends Full Fledged EA and Alert plus for alerts will also be provided in this offer along with the purchase of Indicator. Limited copies only at this price and Ea too. Grab your copy soon Alert plus for indicator with set file is kept in comment section with the image  SMC Blast Signa
Actualmente 20% OFF ! A melhor solução para qualquer novato ou comerciante especializado! Este software de painel de instrumentos está a funcionar em 28 pares de moedas. É baseado em 2 dos nossos principais indicadores (Advanced Currency Strength 28 e Advanced Currency Impulse). Dá uma grande visão geral de todo o mercado Forex. Mostra valores avançados de força da moeda, velocidade de movimento da moeda e sinais para 28 pares de divisas em todos os (9) períodos de tempo. Imagine como a sua n
Scalper Inside PRO
Alexey Minkov
4.74 (69)
An exclusive indicator that utilizes an innovative algorithm to swiftly and accurately determine the market trend. The indicator automatically calculates opening, closing, and profit levels, providing detailed trading statistics. With these features, you can choose the most appropriate trading instrument for the current market conditions. Additionally, you can easily integrate your own arrow indicators into Scalper Inside Pro to quickly evaluate their statistics and profitability. Scalper Inside
Apresentamos o Indicador de Avião F-16, uma ferramenta de ponta para o MT4 projetada para revolucionar sua experiência de negociação. Inspirado na velocidade e precisão incomparáveis do caça F-16, este indicador combina algoritmos avançados e tecnologia de última geração para oferecer um desempenho sem igual nos mercados financeiros. Com o Indicador de Avião F-16, você vai decolar acima da concorrência, pois ele fornece análises em tempo real e gera sinais de negociação altamente precisos. Suas
Dynamic Forex28 Navigator
Bernhard Schweigert
4.43 (7)
Dynamic Forex28 Navigator - A ferramenta de negociação Forex de última geração. ATUALMENTE 49% DE DESCONTO. Dynamic Forex28 Navigator é a evolução dos nossos indicadores populares de longa data, combinando o poder de três em um: Indicador Advanced Currency Strength28 (695 avaliações) + Advanced Currency IMPULSE com ALERTA (520 avaliações) + Sinais CS28 Combo (Bônus). Detalhes sobre o indicador https://www.mql5.com/en/blogs/post/758844 O que o Next-Generation Strength Indicator oferece?  Tudo
Indicador antecipado       Determina os níveis e zonas de reversão do mercado   , permitindo que você espere o preço retornar ao nível e entre no início de uma nova tendência, e não no seu fim. Ele mostra       níveis de reversão       onde o mercado confirma uma mudança de direção e inicia um movimento adicional. O indicador funciona sem redesenhar, é otimizado para qualquer instrumento e revela seu potencial máximo quando combinado com o       LINHAS DE TENDÊNCIA PRO       indicador. Scanner
ACTUALMENTE COM 26% DE DESCONTO A melhor solução para qualquer novato ou comerciante especializado! Este Indicador é uma ferramenta comercial única, de alta qualidade e acessível, porque incorporámos uma série de características proprietárias e uma nova fórmula. Com apenas UM gráfico, pode ler a força da moeda para 28 pares de Forex! Imagine como a sua negociação irá melhorar porque é capaz de apontar o ponto exacto do gatilho de uma nova tendência ou oportunidade de escalada? Manual do util
Hidden Cycles
Lev Vladimirovic Marushkin
5 (1)
Christmas Sale! – The Only 100% Universal Tool Grab Hidden Cycles for only $129 (regular price $179). Stop trading against nature! This is your chance to secure the only indicator rooted in the absolute laws that govern the entire universe. Most tools guess—this one reveals the truth. Offer ends soon — Buy another toy or buy the truth. Your choice... Based on Universal Laws — NOT Some Guy’s Algorithm: Let the market adjust to the Hidden Cycles Geometry — not the other way around. Most indicat
Shogun Trade
Yuki Miyake
5 (1)
SHOGUN Trade [Concept: Command the Market Structure] To win a war, one must see the entire battlefield, not just the skirmishes. SHOGUN Trade elevates your perspective from a reactive foot soldier to a strategic "Commander." By synchronizing analysis across 7 timeframes and identifying the maturity of trends, it allows you to govern your trades with the authority and patience of a "Shogun," entering the market only when the structural advantage is undeniable. 5 Strategic Benefits of Installi
Se você comprar este indicador, receberá meu Gerenciador de Operações Profissional   + EA  GRATUITAMENTE. Primeiramente, vale ressaltar que este Sistema de Trading é um Indicador Não Repintado, Não Redesenho e Não Atrasado, o que o torna ideal tanto para o trading manual quanto para o automatizado. Curso online, manual e download de predefinições. O "Sistema de Trading Inteligente MT5" é uma solução completa de trading projetada para traders novos e experientes. Ele combina mais de 10 indicador
Volatility Trend System - um sistema de negociação que dá sinais para entradas. O sistema de volatilidade fornece sinais lineares e pontuais na direção da tendência, bem como sinais para sair dela, sem redesenho e atrasos. O indicador de tendência monitora a direção da tendência de médio prazo, mostra a direção e sua mudança. O indicador de sinal é baseado em mudanças na volatilidade e mostra entradas no mercado. O indicador está equipado com vários tipos de alertas. Pode ser aplicado a vários i
FX Power MT4 NG
Daniel Stein
4.95 (20)
FX Power: Analise a Força das Moedas para Decisões de Negociação Mais Inteligentes Visão Geral FX Power é a sua ferramenta essencial para compreender a força real das principais moedas e do ouro em quaisquer condições de mercado. Identificando moedas fortes para comprar e fracas para vender, FX Power simplifica as decisões de negociação e revela oportunidades de alta probabilidade. Quer você prefira seguir tendências ou antecipar reversões usando valores extremos de Delta, esta ferramenta adap
Entry Points Pro
Yury Orlov
4.62 (172)
Este é um indicador para MT4 que fornece sinais precisos para entrar em uma negociação sem redesenhar. Ele pode ser aplicado a qualquer ativo financeiro: forex, criptomoedas, metais, ações, índices. Ele fornecerá estimativas bastante precisas e informará quando é melhor abrir e fechar um negócio. Assista o vídeo (6:22) com um exemplo de processamento de apenas um sinal que compensou o indicador! A maioria dos traders melhora seus resultados de negociação durante a primeira semana de negociação c
Adaptive Volatility Range [AVR] is a powerful tool for identifying key trend reversal points. AVR accurately reflects the Average True Range (ATR) of volatility, taking into account the Volume-Weighted Average Price (VWAP). The indicator adapts to any market volatility by calculating the average volatility over a specific period, ensuring a stable rate of profitable trades. You receive not just an indicator but a professional automated trading system , AVR-EA . Advantages: Automated Trading Sys
ACTUALMENTE COM 26% DE DESCONTO!! Este indicador é uma super combinação dos nossos dois principais indicadores ( Advanced Currency Strength 28   &  Advanced Currency IMPULSE with ALERT ). Mostra valores de Força da Moeda para TICK-UNITS e sinais de alerta para 28 pares de Forex. Podem ser usadas 11 Tick-Units diferentes. Estas são 1, 2, 3, 4, 5, 6, 10, 12, 15, 20, e 30 segundos. A barra de Tick-Unit na sub-janela será mostrada e deslocada para a esquerda quando houver pelo menos 1 tick dentro
Indicador único que implementa uma abordagem profissional e quantitativa para significar negociação de reversão. Ele capitaliza o fato de que o preço desvia e retorna à média de maneira previsível e mensurável, o que permite regras claras de entrada e saída que superam amplamente as estratégias de negociação não quantitativas. [ Installation Guide | Update Guide | Troubleshooting | FAQ | All Products ] Sinais de negociação claros Incrivelmente fácil de negociar Cores e tamanhos personalizáveis
Currency Strength Exotics
Bernhard Schweigert
4.88 (33)
ACTUALMENTE 20% DE DESCONTO ! A melhor solução para qualquer novato ou comerciante especializado! Este Indicador é especializado para mostrar a força da moeda para quaisquer símbolos como Pares Exóticos de Commodities, Índices ou Futuros. É o primeiro do seu género, qualquer símbolo pode ser adicionado à 9ª linha para mostrar a verdadeira força da moeda de Ouro, Prata, Petróleo, DAX, US30, MXN, TRY, CNH etc. Esta é uma ferramenta de negociação única, de alta qualidade e acessível, porque inco
Advanced Supply Demand
Bernhard Schweigert
4.91 (296)
Atualmente com 33% de desconto! A melhor solução para qualquer Trader Novato ou especialista! Este indicador é uma ferramenta de negociação exclusiva, de alta qualidade e acessível porque incorporamos uma série de recursos proprietários e uma nova fórmula. Com esta atualização, você poderá mostrar fusos horários duplos. Você não só será capaz de mostrar um TF mais alto, mas também mostrar ambos, o TF do gráfico, MAIS o TF mais alto: MOSTRANDO ZONAS ANINHADAS. Todos os traders de Oferta e Demanda
Atomic Analyst
Issam Kassas
5 (3)
Primeiramente, vale ressaltar que este Indicador de Negociação não repinta, não redesenha e não apresenta atrasos, tornando-o ideal tanto para negociação manual quanto automatizada. Manual do utilizador: configurações, entradas e estratégia. O Analista Atômico é um Indicador de Ação de Preço PA que utiliza a força e o momentum do preço para encontrar uma vantagem melhor no mercado. Equipado com filtros avançados que ajudam a remover ruídos e sinais falsos, e aumentam o potencial de negociação.
GOLD Impulse with Alert
Bernhard Schweigert
4.64 (11)
Este indicador é uma super combinação dos nossos 2 produtos Advanced Currency IMPULSE with ALERT  +   Currency Strength Exotics . Funciona para todos os períodos de tempo e mostra graficamente impulso de força ou fraqueza para as 8 principais moedas mais um Símbolo! Este Indicador é especializado para mostrar a aceleração da força da moeda para quaisquer símbolos como Ouro, Pares Exóticos, Commodities, Índices ou Futuros. É o primeiro do seu género, qualquer símbolo pode ser adicionado à 9ª
Cycle Sniper
Elmira Memish
4.39 (36)
Please contact us after your purchase and we will send you the complimentary indicators to complete the system Cycle Sniper is not a holy grail but when you use it in a system which is explained in the videos, you will feel the difference. If you are not willing to focus on the charts designed with Cycle Sniper and other free tools we provide, we recommend not buying this indicator. We recommend watching the videos about the indiactor and system before purchasing. Videos, settings  and descri
Os indicadores de tendência são uma das áreas de análise técnica para utilização em negociações em mercados financeiros. Indicador de Angular Trend Lines - determina de forma abrangente a direção da tendência e gera sinais de entrada. Além de suavizar a direção média das velas Também utiliza o ângulo de inclinação das linhas de tendência. O princípio de construção dos ângulos de Gann foi tomado como base para o ângulo de inclinação. O indicador de análise técnica combina a suavização de velas e
Supply and Demand Dashboard PRO
Bernhard Schweigert
4.8 (20)
Actualmente 20% OFF ! Este painel é uma peça de software muito poderosa que trabalha em múltiplos símbolos e até 9 prazos. Baseia-se no nosso principal indicador (Melhores críticas: Advanced Supply Demand ).   O tablier dá uma óptima visão geral. Mostra:   Valores filtrados da Oferta e da Procura, incluindo a classificação da força da zona, Distâncias de/para as zonas e dentro das zonas, Destaca as zonas aninhadas, Dá 4 tipos de alertas para os símbolos escolhidos em todos os (9) períodos de
Volatility Master for MetaTrader is a real-time dashboard tool that scans up to 56 symbols using up to 2 flexible dashboards on different charts to identify high-volatility, trending markets instantly. With clear bullish/bearish signals, customizable alerts, and a user-friendly interface, it helps you avoid range-bound conditions and focus on high-probability trades. Clarity leads to confidence. Trade confidently and protect your capital effectively with this powerful dashboard. Setup & Guide: 
BinaryIndicator
Andrey Spiridonov
BinaryIndicator is a highly accurate indicator for trading binary options. It shows excellent results in scalping. This indicator is based in multifactor analysis of trend indicators, as well as confirmation oscillators, which in the end gives an increased accuracy of signals. Advantages of the indicator Increased accuracy of signals. Excellent results when trading binary options with a short expiration time from M30 to M1 . It works on any timeframes. Works with any trade symbols. Parameters
PipFinite Trend PRO
Karlo Wilson Vendiola
4.88 (2248)
Breakthrough Solution For Trend Trading And Filtering With All Important Features Built Inside One Tool! Trend PRO's smart algorithm detects the trend, filters out market noise and gives entry signals with exit levels. The new features with enhanced rules for statistical calculation improved the overall performance of this indicator. Important Information Revealed Maximize the potential of Trend Pro, please visit www.mql5.com/en/blogs/post/713938 The Powerful Expert Advisor Version Automatin
Gold Venamax MT4
Sergei Linskii
5 (1)
Gold Venamax   - este é o melhor indicador técnico de ações. O algoritmo do indicador analisa o movimento do preço de um ativo e reflete a volatilidade e as zonas de entrada potenciais. Recursos do indicador: Este é um super indicador com Magic e dois blocos de setas de tendência para uma negociação confortável e lucrativa. O botão vermelho para alternar blocos é exibido no gráfico. Magic é definido nas configurações do indicador, para que você possa instalar o indicador em dois gráficos exibin
Trend Lines PRO
Roman Podpora
5 (1)
LINHAS DE TENDÊNCIA PRO       Ajuda a entender onde o mercado está realmente mudando de direção. O indicador mostra inversões de tendência reais e pontos onde os principais participantes retornam ao mercado. Você vê     Linhas BOS     Análise de tendências e níveis-chave em prazos maiores — sem configurações complexas ou ruídos desnecessários. Os sinais não são repintados e permanecem no gráfico após o fechamento da barra. O que o indicador mostra: Mudanças reais  tendência (linhas BOS) Uma vez
Title: BBMA Structure Guide - BBMA Structure Guide Description: BBMA Structure Guide is a specialized MQL4 indicator designed to help traders understand the journey of BBMA structure more easily and efficiently. BBMA, or "Bollinger Bands Moving Average," is known for its motto "One Step Ahead," highlighting the importance of understanding market structure in depth. With BBMA Structure Guide, you can quickly identify the underlying market structure patterns that drive price movements. This wil
Mais do autor
Target Geometry
Chantal Sala
4 (4)
Target Geometry is a next-generation indicator that uses the geometric nature of the markets to give high statistical probability levels ( Fibonacci ). This indicator creates a very important map that optimizes the entry points and it optimally defines your own money management. The indicator can be used both in static mode or in dynamic mode, you can use it on any financial instrument. The use in multi timeframe mode is a very good ally to have. The target levels are high statistical probabilit
Time Range Separator  is a useful tool to display a separator period on your platform. You could go in the properties of the indicator, select the desired range and that's ALL. We believe it is a useful and necessary that we wish to share with you for free all our followers. Input Values: TimeFrame = Period Separator Separator_Color = Vertical Color Line Separator_Style = Vertical Color Style Separator_Width = Vertical Line Width Good trading to all and see you soon. Same indicator for MT4 here
FREE
Time Range Separator
Chantal Sala
4.83 (6)
Time Range Separator is a useful tool to display a separator period on your platform. You could go in the properties of the indicator, select the desired range and that's ALL. We believe it is a useful and necessary that we wish to share with you for free all our followers. Input Values: TimeFrame Period Separator GMT_Hour (ex. +1 or -1) to move the lines at Period Time +/- tot hours in input Hide_dates to show or hide the datetime on vertical lines VLine_Color = Vertical Color Line VLine_Style
FREE
Delta Single Volume
Chantal Sala
3.67 (3)
Volume Delta is a very powerful indicator that reads the supply on the Market. It calculates the Delta from movement of the price and the difference of BUY and SELL Tick volumes. Its special structure allows you to get all timeframe values available on the MT4 platform. A good observation of this instrument can suggest great entry points and possible reversal. We are confident that this tool will help you to improve your trading timing. See also for MT5:  https://www.mql5.com/en/market/product/5
Delta Single Volume is a very powerful indicator that reads the supply on the Market. It calculates the Delta from movement of the price and the difference of BUY and SELL volumes. Its special structure allows you to get all timeframe values available on the MT5 platform. It works on Tick Volumes and Real Volumes (if avalaibles on your Broker). A good observation of this instrument can suggest great entry points and possible reversal. We are confident that this tool will help you to improve you
This is a utility to copy in Expert Advisor folder. The EA will force the download of your History Center MetaTrader. It will not download new data from your broker but it will aid your MT4 to charge every chart correctly. You can choose the symbols to download. After the launch, the EA will be removed automatically from the chart. After the launch, you can see results under Experts panel on MT4. The log will show you the data charged or not charged. Symbol TF = Number of candles charged. Ex: Su
FREE
Volume Spyke
Chantal Sala
4 (1)
The Volume Spike indicator is a useful tool to identify the directional market's intention. How Does It Work: The Volume Spike indicator identifies the volume peaks and creates a sensitive rectangle equipped with Alert and Warning Pop Up that it suggests the market's direction. This tool has the ability to select the time frame on which to do the analysis of volume and it gives a great visual signal colored into rectangle. The indicator can identify valid market signals but it can also suggest
HLOC
Chantal Sala
5 (3)
High Low Open Close Levels The indicator HLOC is a good ally to correctly identify the appropriate trend of price. The indicator is designed to be minimally invasive and it shows a visual and sound aid in order to take decision on the market. The indicator is equipped with sound alert and window alert in order to have a reminder of the price movements. We suggest you watch the video below to evaluate its operational benefits. Input values: Show Level (true/false) TimeFramePeriod (refer to lines
InfoPanelMarket
Chantal Sala
3.5 (4)
Informational indicator which shows: Swap Price under/upper Open for every Time Frame Spread Time to close the current candle Broker Time Net Change: delta in percentage from Open (MN-W1-D1) Tick Value Volumes Info for every trades open: Lots Breakeven Profit Buy-Profit Sell Equity Symbol Positive values are green and negative values are red (modifiable in input). Inputs: View BE line (enable/disable) View all Symbol (shows the list of symbol) Color (for every text) Line Color (for BE line)
This panel is very simple to use and it is a very ally to manage your positions and orders. Also you can modify your risk, writing in fields directly on Panel. One click on buttons and the operation on market is done! Operations possible: BUY/SELL Break Even Split (close 50% all orders) Close All positions Hedging (opens reverse positions to cover) Close only BUY positions Close only SELL positions Close All pending orders Reverse all positions Please watch the video to verify the very simple u
BreakEven Line is a very useful and easy to use indicator. In case of multiple positions opened on the same instrument, the indicator shows the breakeven point where it is possible to close the positions. Its graphic simplicity makes it an unobtrusive and customizable tool. You can enable/disable a line on a chart, so you can make the indicator invisible. Inputs Show cumulative BE (line on/off) Breakeven line color (to change the line color) Breakeven line style Breakeven line width Show short B
Volume POC
Chantal Sala
5 (2)
Volume POC The Volume POC indicator displays important levels. You can use it as an independent trading system. Warning functions at a candle closing allow you to have some information on the market direction. The graphical display is simple and effective. The levels reported are the result of the study of historical market volumes. These levels give excellent entry points and excellent levels of support and resistance. You can use the indicator also on very low timeframes. It is suitable for t
Open All
Chantal Sala
The Open All indicator uses a simple market information that is "Open Candle". This tool is able to show all the openings of all time frames in order to extract information of strength and trendy. You can display 28 instruments with relative time frame interior for a total of 252 informations. The display is fully customizable, you can choose either the symbol and enable/disable Time Frames. Using it correctly you could get valuable aid to intercept correlations and turning points in the market.
The indicator Net Change is a very useful tool able to extrapolate a percentage in order to have a real reference on the performance of the instrument. This indicator is designed to show the main values: you could monitor the Daily, Weekly, Monthly, Quarterly, Semi-annual and Annual percentages. A necessary tool for those who want to really explore the quantitative logic of the market. Input values SYMBOLS SETTINGS Use_Only_Current_Symbol (true/false): Permits to manage only current symbol on p
Best And Worst
Chantal Sala
5 (1)
The Best and Worst indicator (similar to Net Change Indicator) has the peculiarity of being a dynamic indicator. It seems a very Stock Exchange Indicator. This means that it is able to draw up a list and put in order the best and worst instruments in descending order. You can choose to show the percentage of any Time Frame: 1M, 5M, 15M, 30M, H1, H4 etc ... This instrument could really give great suggestions on your trading in order to center the right time and to have a total view of the markets
Volume Delta Panel
Chantal Sala
4.8 (10)
Volume DeltaPanel is a very powerful indicator that read the supply on Market. It calculates the Delta from movement of the price and the difference of BUY volumes and SELL volumes. The Volumes are added to price and normalized to symbol points. Its special structure allows you to get all Time Frames values available on the platform MT4. Panel can show 28 instruments simultaneously all customizable according to the offer of the Broker. A good observation of this instrument can suggest great ent
Price Trend Light
Chantal Sala
4 (1)
Price Trend Light indicator is a beautiful indicator that shows purchasing areas and sales areas. This indicator is designed to follow the movement of the price which rounds on the opening price. It also provides information of trend follow on the break of the minimum and maximum. The indicator has a very simple graphic but effective, above the opening price you will have a light green color and under the opening price there is a red light. On every Break Out of the minimum or maximum sets in in
The indicator Power Strength creates a virtual display that takes data from all Symbols. It extrapolates all the informations in order to get the strength and / or weakness to take a decision on market. This tool works only on the Forex Market and not processing data on indices, metals ... It is graphically very attractive and its simplified information could give excellent input signals. You can use this indicator to find inputs on daily or short-term operations or scalping. Input Values PANEL
Zoom Price It is a very useful tool that is designed to ZOOM the price positioning on one of the 4 corners of the graph. In addition to display function of the price indicator, Zoom Price is equipped with a check on Bullish or Bearish Breakout Signal that change the label color. Zoom Price is a simple tool that can provide useful informations to improve your operational performance. Input Values: myPeriod - TF to consider for Break Out O Signal LABEL SETTINGS Bullish BreakOut Color Bearish Break
The Price Action Dashboard is an innovative tool to help the trader to control a large number of financial instruments. This tool is designed to automatically suggest signals and price conditions. The Dashboard analyzes all major Time Frame suggesting price action conditions with graphic elements. The Dashboard can suggest you the strength of the trend identifying directional movement, it is an indispensable tool for those who want to open position themselves using market trends identifiers. The
Master Trend Dashboard is a new generation indicator, compact, light and efficient. Each element of this Dashboard is designed to return specific signals as: Price Action, Breakout, Net Change (performance of the instrument), algorithmic studies, correlations and statistical calculations. This tool will change your way of trading allowing you to receive important information. See the Graphic Signals to understand every single signal below: Graphic Signals Symbol name and arrow color Green = Cur
Box Chart
Chantal Sala
5 (1)
The indicator Box Chart is a very useful analysis tool that allows you to know the value of the range in points. The range is written in a label and also it is draw in a rectangle. This indicator works on multi timeframe and you can upload more indicators on same chart to analyze more time frames ranges. The analysis of the range is done following W. G. Gann school. The observation of the range on little time frame returns some good information of trend or reversal. Box Chart is a simple indicat
Navigator FX
Chantal Sala
5 (1)
The Navigator is a next-generation panel very easy to use. Apply this indicator on the chart to navigate very quickly through all the symbol and timeframes listed in input. The arrows manage the zoom and time frames. You can customize both the graphic colors and the list of symbols to display. A quick and easy tool that it will help to analyse the charts. Input Values Show_TF_Panel (true/false) it permits to show/hide panel with TF and Arrows 32 symbols COLORS AND SIZE SETTINGS BUTTON_WIDTH But
OCO News Order Manager in an Expert Advisor to Trading News . The usability makes this tool an excellent ally for FAST operations on NEWS Time. We recommend that you try it on demo account to understand what kind of decimals using your broker to set your input values. The EA is usable on every Markets. On news time the spread could be manage from Broker, please make attention. Main functionalities Open STOP PENDINGS ORDER a number of seconds (in input) before News Time Floating of pending order
Dax Scalping Bracket is a new generation Expert Advisor Panel. This a very professional tool for SCALPING. The usability makes this tool an excellent ally for FAST operations of SCALPING on Index instruments and Forex market. The main feature of this EA is the ability to open multiple operations with a single click. Each position is autonomous and you can set different take profit and stop loss for each position. Special functionalities: STOP MOVE to manage your stop chasing the price BREAK EVEN
Bid Ask Level is a very simple indicator but, at the same time, very powerful . Using the logic of the minimum and maximum of the previous periods is able to intercept the important levels of demand and supply. The indicator permits setting the numbers of history candles to read very important levels in the past and show them in the current chart. You can see these power levels with horizontal lines designed on the chart. The indicator also permits uploading many different levels (of different t
Market Pressure Dashboard is a new generation utility. Its main function is to assist you and give you operational ideas optimizing your analytical work. Using this utility you could monitor a lots of financial instruments (max 28 symbols FOREX) in a very simple way. The Market Pressure indicator allows you to customize the internal list of the symbols to be monitored. The opening function and position management with this panel will be much more comfortable and navigation charts very powerful.
Risk Reward indicator is a very useful tool that allows you to observe in real time the performance risk of a trade. Its use is very simple, just drag it into the chart and see the Risk Reward percentage (for ex: 1:2). We have also included the possibility of extending/reducing the lines in order to observe the important price levels. You can change your levels clicking directly on lines and dragging the level to a new position. The levels will be set very fast with only a click. The indicator k
Open Line
Chantal Sala
3 (1)
The Open Line indicator is a simple indicator that tracks the opening levels of more time sessions. This version allows the user to check the opening levels using different time time frames. It is possible to add on the same chart different Open Lines to have more important horizontal levels. The colors and lines are fully customizable also for the label text. A simple indicator but very powerful to give you a proper orientation for your trading. Input Values TimeFrame (to show the open price t
Swing High Low
Chantal Sala
5 (2)
Swing High Low Pattern Recognition is a great indicator able to fix price levels and analyze the market swings. Swing High Low uses a dynamic approach of analysis that allows you to identify easily the best entry levels. The indicator using the minimum and maximum periods of the previous candles to analyze the impulsive movement and finally it sets the entry levels. The entry levels are: fast, good and best . The best is the last confirm of the swing. For a correct use we advise to wait the comp
Filtro:
Sem comentários
Responder ao comentário