Triple Graphics Channel
- Indicadores
- Versión: 1.0
- Activaciones: 5

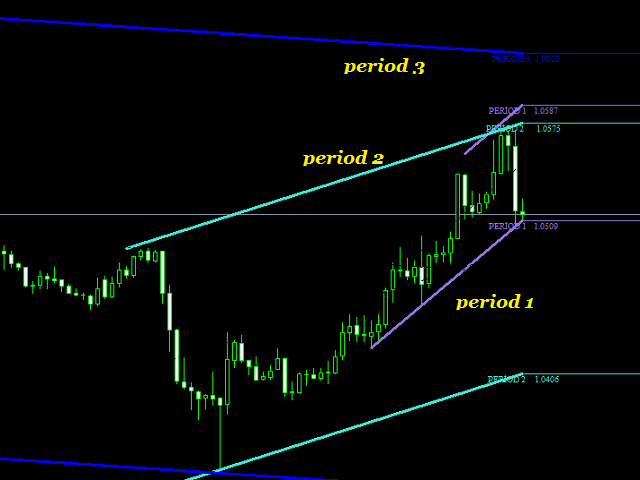
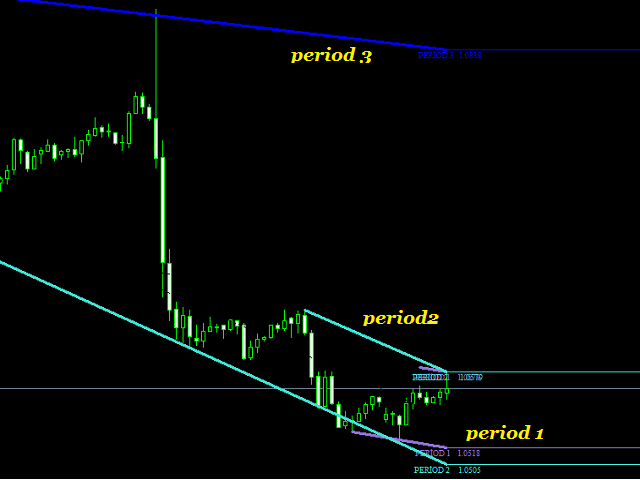
¿Está cansado de los canales? Este indicador está diseñado para dibujar canales. Canales gráficos triples, instala automáticamente 3 canales gráficos diferentes. Estos canales se muestran en un único gráfico.
Estos canales se calculan mediante diferentes algoritmos. Dibuja automáticamente en la pantalla. Puede seleccionar tres zonas horarias.
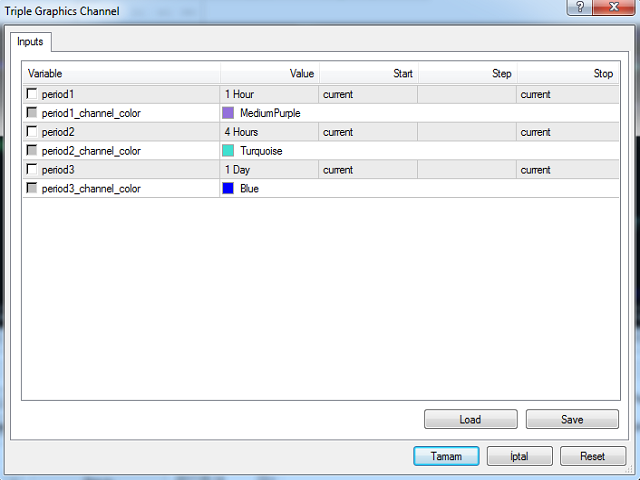
Parámetros
- Periodo1 - desde aquí puede seleccionar el primer periodo. Se puede seleccionar desde un periodo de tiempo de 1 minuto hasta un periodo de tiempo mensual.
- Period1_Channel_Color - aquí se establece el color del periodo1.
- Period2 - aquí puede elegir el segundo periodo. Se puede seleccionar desde 1 minuto hasta un mes.
- Period2_Channel_Color- aquí se ajusta el color del periodo2.
- Period3 - aquí puede elegir el tercer canal. Se puede seleccionar desde 1 minuto hasta un mes.
- Period3_Channel_Color- aquí se ajusta el color del periodo3.

El usuario no ha dejado ningún comentario para su valoración