Openology
- Indicadores
-
Chantal Sala
 Hi, I'm a programmer (female) from 1995 and in MQL4 from 2008.
I have released most of 2500 Expert Advisor/Indicators and Dashboard.
I have worked with many famous italian traders to automate their strategy. - Versión: 1.0
- Activaciones: 10
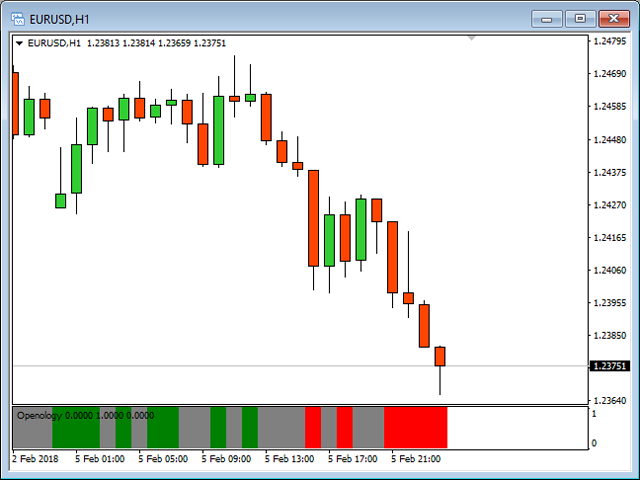
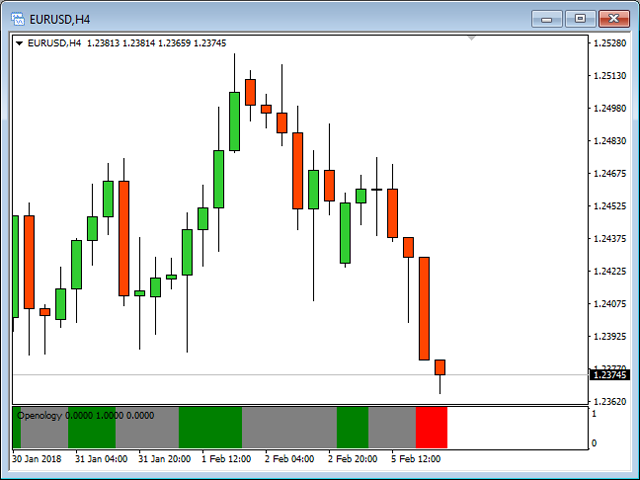
Openology es un indicador muy sencillo que puede mostrar la información histórica de los niveles de precios de apertura.
El histograma tiene de hecho la tarea de mostrar la historia de este valor con el fin de estudiar las condiciones de permanencia y duración de esta condición de mercado muy importante.
El indicador, en ventana separada, no es intrusivo y a través de su personalización interna extremadamente simple en el uso.
Muy importante es la posibilidad de activar o desactivar un marco de tiempo para mostrar el acuerdo de estudio sobre el Precio de Apertura.
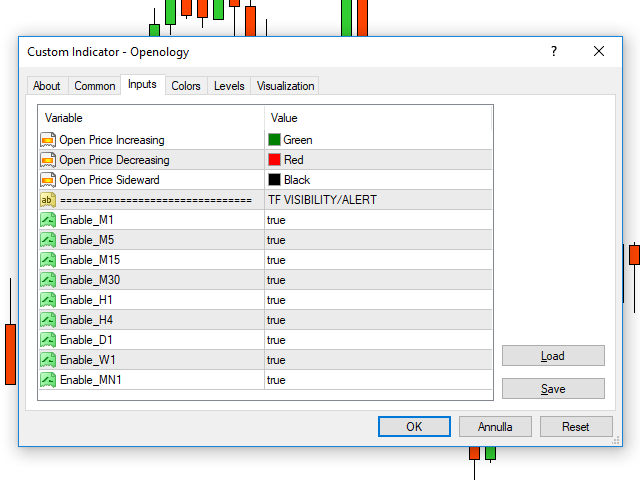
Entradas
- Precio Abierto Color creciente
- Precio Abierto Color decreciente
- Open Price Sideward color
- TF VISIBILIDAD/ALERTA
- Activar_M1
- Activar_M5
- Activar_M15
- Activar_M30
- Habilitar_H1
- Habilitar_H4
- Habilitar_D1
- Habilitar_W1
- Activar_MN1