Buy Sell Trigger MT4
- Indicadores
- Versión: 3.82
- Actualizado: 24 marzo 2020
- Activaciones: 5

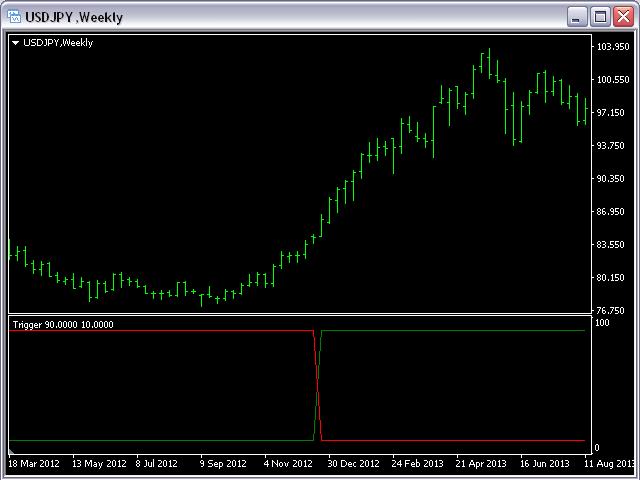
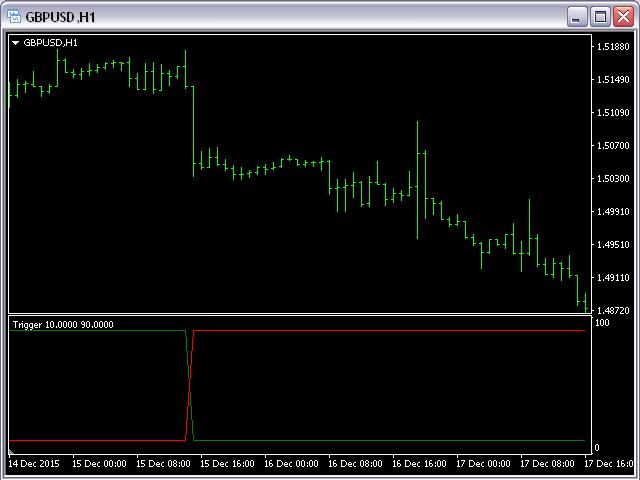
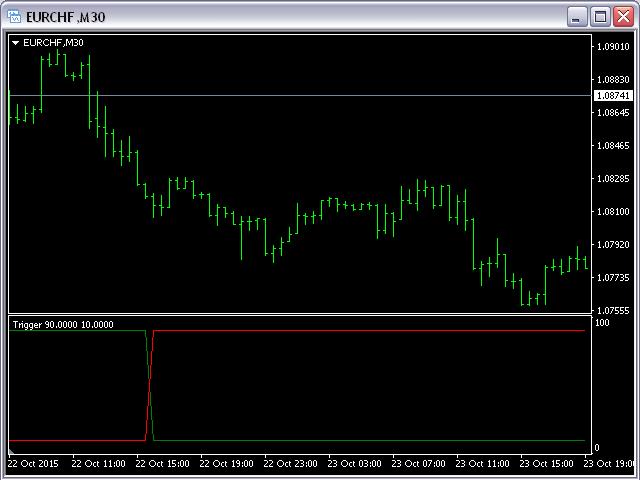
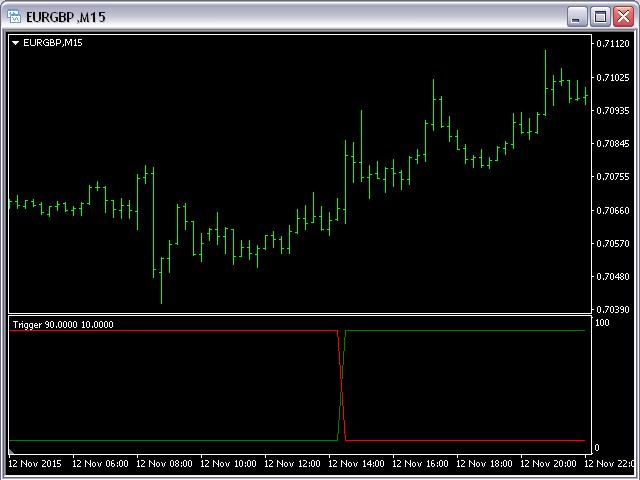
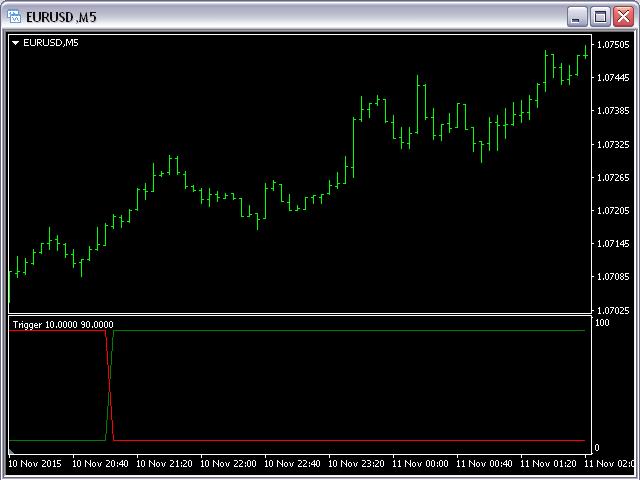
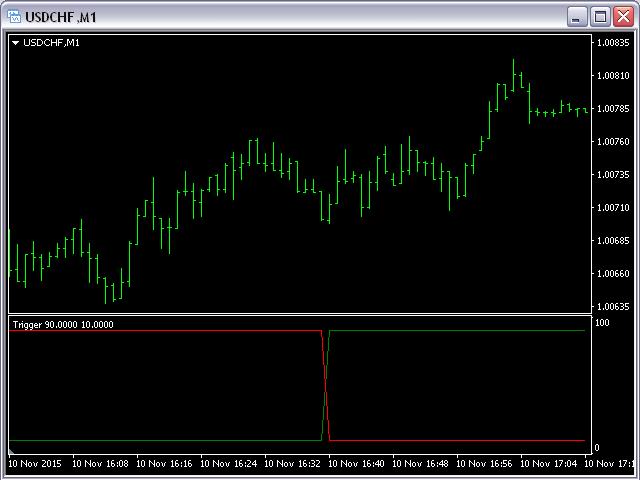
La única función de este indicador es mostrar un momento en el que la tendencia del precio ha cambiado.
Si una línea verde cruza una línea roja descendente y ascendente, es muy probable que la tendencia del precio sea ascendente.
Si una línea roja cruza una línea verde descendente, es muy probable que la tendencia del precio sea descendente.
El indicador puede utilizarse en cualquier marco temporal y par de divisas.