Mr Big
- Indicadores
-
Pavel Verveyko
 Writing scripts, indicators, EAs on MQL5 and MQL4.
Fast, Reliable, And High-Quality.
For all questions, please contact personal messages. - Versión: 1.4
- Actualizado: 4 abril 2022
- Activaciones: 5
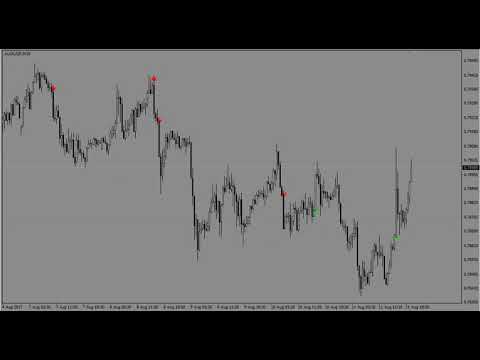
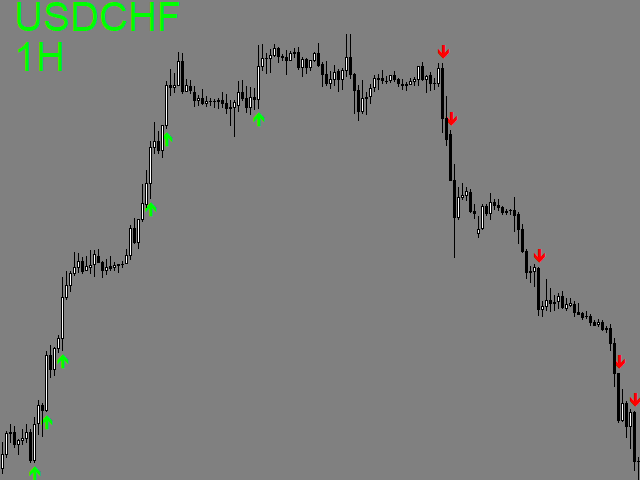
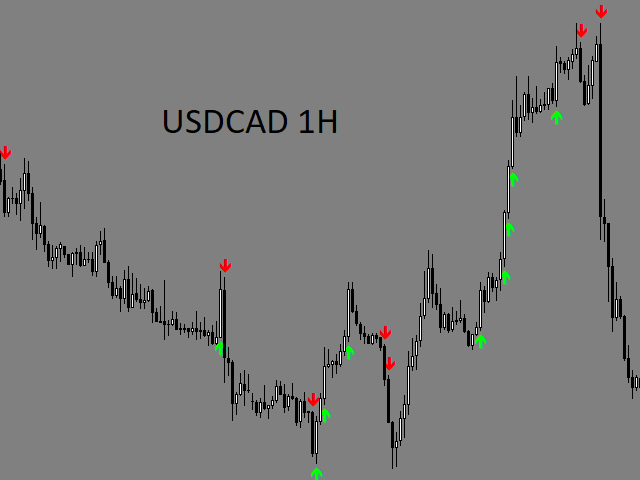
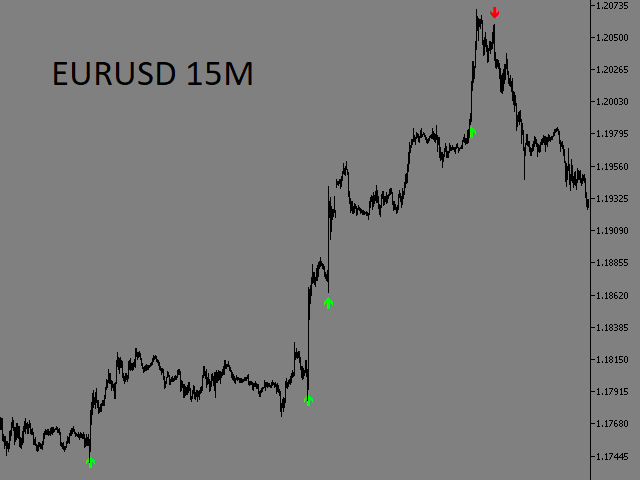
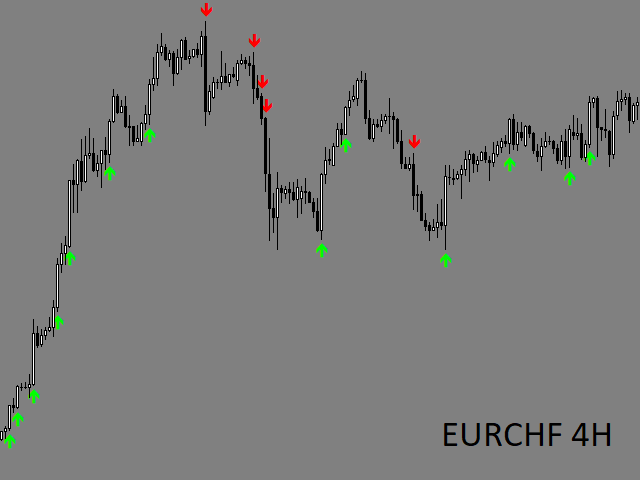
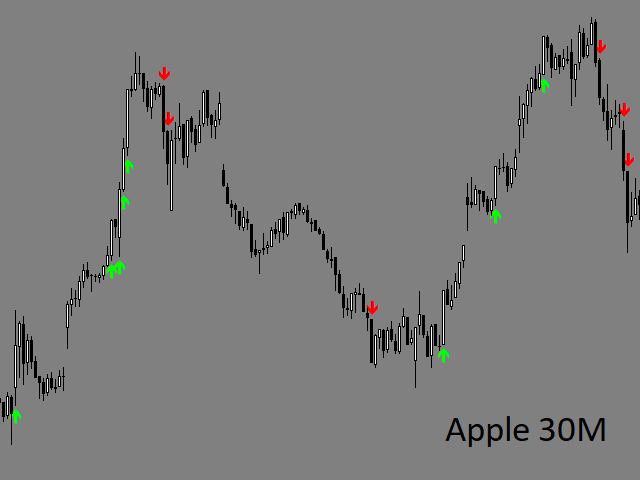
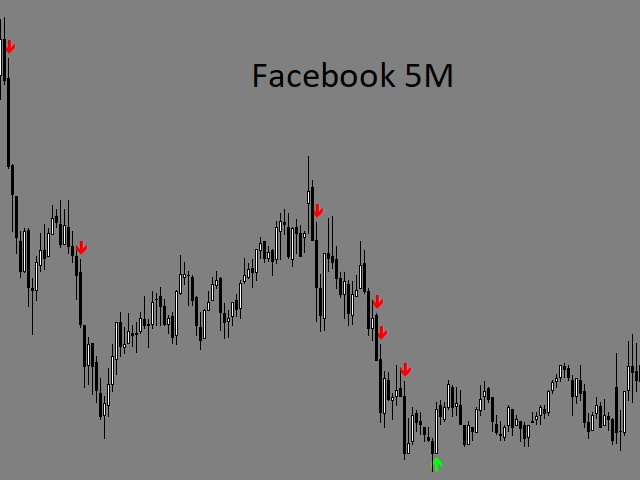
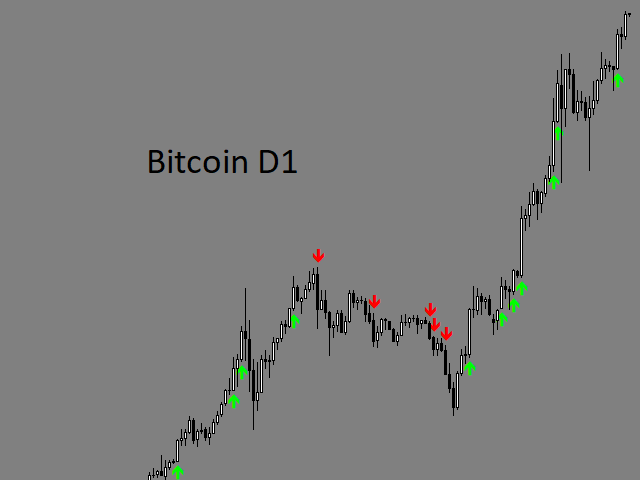
El indicador muestra y destaca las velas del gráfico, que se forman como resultado de la entrada en el mercado de grandes participantes en grandes volúmenes. Estas velas también pueden formarse después de lograr una certeza en el mercado, cuando la mayoría de los participantes mantienen posiciones en la misma dirección. Es probable que el movimiento continúe en esa dirección después de dichas velas.
- El indicador destaca las velas significativas de entre las existentes en el gráfico;
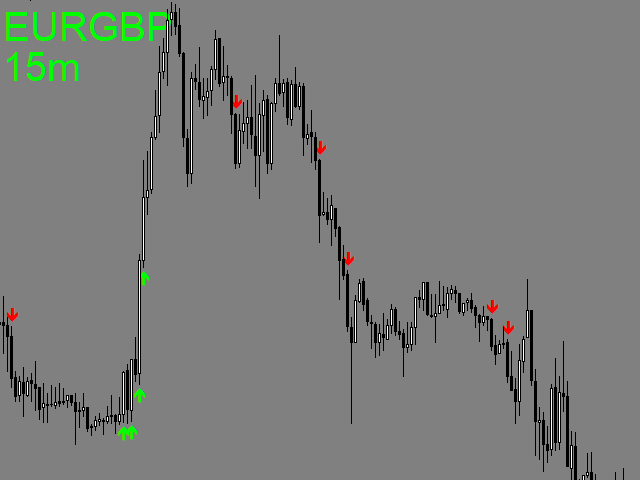
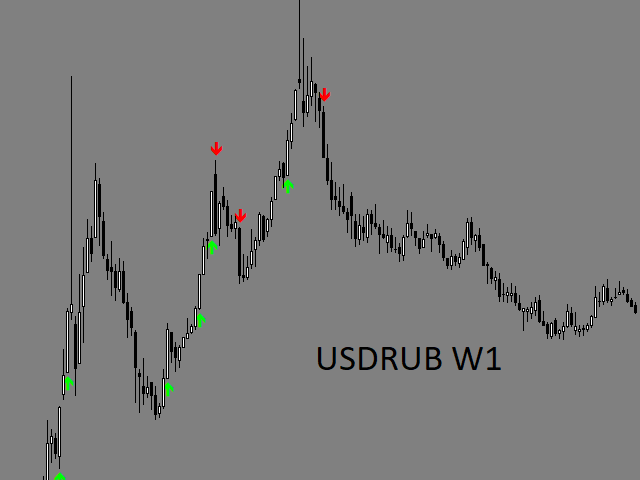
- El indicador permite identificar las tendencias basadas en velas, en las que se refuerzan las posiciones hacia la tendencia principal;
- Es posible filtrar las señales (velas) por volatilidad, y mostrar sólo las que superen el número de puntos especificado. (este parámetro puede ser el mismo para todos los marcos temporales o diferente para cada marco temporal);
- Es posible filtrar según el siguiente principio: mostrar sólo las velas que rompen un determinado nivel del precio en el que se basa (calculado matemáticamente), o ignorar esta condición;
- Es posible filtrar la visualización de señales por tiempo, o ignorar esta condición (tiempo terminal en el gráfico);
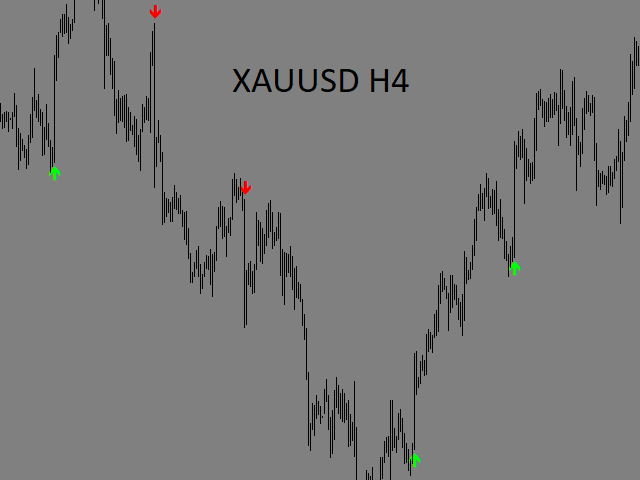
- El indicador se puede utilizar en cualquier marco temporal, en cualquier instrumento;
- Se puede utilizar para el comercio a largo y medio plazo o scalping.
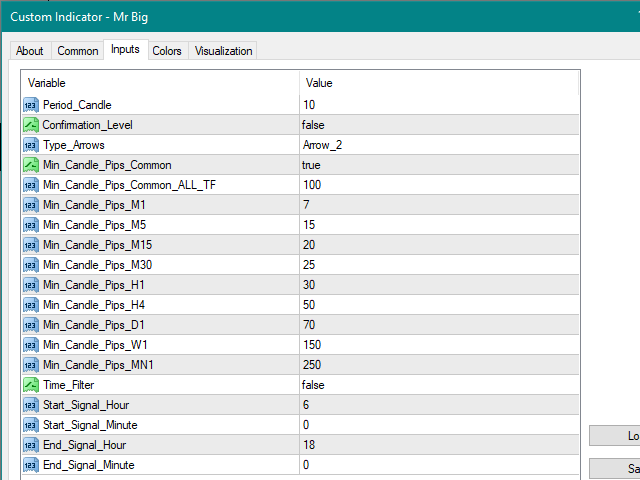
Ajustes
- Period_Candle - periodo de cálculo para la búsqueda de señales;
- Confirmation_Level - si se establece en true, la señal debe romper un cierto nivel de precios en el que se basa; si es false, la condición se ignora;
- Type_Arrows - tipo de flechas;
- Min_Candle_Pips_Common - filtro de la volatilidad de la señal (vela) en puntos, (las señales menores que los valores especificados en las variables Min_Candle_Pips_ no se mostrarán):
- Si se establece en true, entonces se utiliza como filtro un valor de la variable Min_Candle_Pips_Common_ALL_TF, común para todos los timeframes;
- Si es false, entonces se usan valores separados de las variables Min_Candle_Pips_XX para cada timeframe.
- Min_Candle_Pips_Common_ALL_TF - tamaño de la señal en puntos, común para todos los marcos temporales;
- Min_Candle_Pips_M1 - tamaño de la señal en puntos, utilizado para el marco temporal M1;
- Min_Candle_Pips_M5 - tamaño de la señal en puntos, utilizado para el marco temporal M5;
- Min_Candle_Pips_M15 - tamaño de la señal en puntos, utilizado para el marco temporal M15;
- Min_Candle_Pips_M30 - tamaño de la señal en puntos, utilizado para el marco temporal M30;
- Min_Candle_Pips_H1 - tamaño de la señal en puntos, utilizado para el marco temporal H1;
- Min_Candle_Pips_H4 - tamaño de la señal en puntos, utilizado para el marco temporal H4;
- Min_Candle_Pips_D1 - tamaño de la señal en puntos, utilizado para el marco temporal D1;
- Min_Candle_Pips_W1 - tamaño de la señal en puntos, utilizado para el marco temporal W1;
- Min_Candle_Pips_MN1 - tamaño de la señal en puntos, utilizado para el marco temporal MN1;
- Time_Filter - filtro de visualización de las señales por tiempo;
- Start_Signal_Hour - hora para comenzar a mostrar las señales (hora terminal en el gráfico);
- Start_Signal_Minute - minuto para empezar a mostrar las señales (hora terminal en el gráfico);
- End_Signal_Hour - hora de finalización de la visualización de las señales (hora terminal en el gráfico);
- End_Signal_Minute - minuto para dejar de mostrar las señales (hora terminal en el gráfico).