Double EMA
- Indicadores
- Versión: 1.13
- Actualizado: 1 marzo 2019

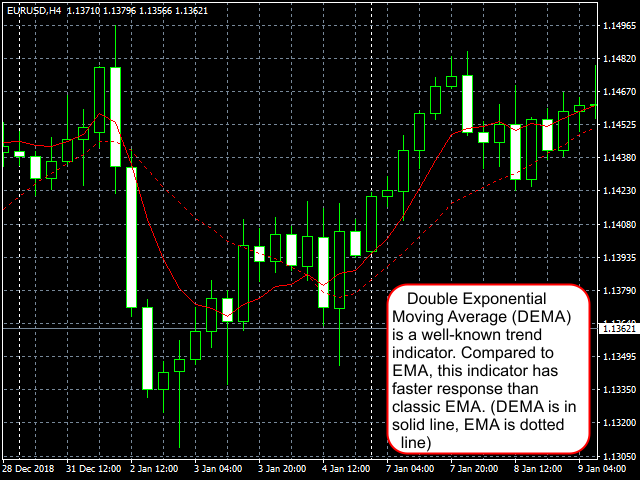
La media móvil exponencial doble (DEMA) es un indicador de tendencia muy conocido. El DEMA fue desarrollado por Patrick Mulloy y publicado en febrero de 1994 en la revista "Technical Analysis of Stocks & Commodities". Se utiliza para suavizar series de precios y se aplica directamente en un gráfico de precios de un valor financiero. Además, puede utilizarse para suavizar los valores de otros indicadores. La ventaja de este indicador es que elimina las señales falsas en el movimiento de precios en dientes de sierra y permite guardar una posición en una tendencia fuerte. (Referencia: Temas de Ayuda MT5)
Entrada Descripción:
- Periodo: Periodo de la MA. Debe ser mayor que 1.
- precio_aplicado: Define el precio a aplicar. Utilice 1 de estos enteros
- 0 -> applied_price es Precio de Cierre
- 1 Precio de apertura
- 2 Precio alto
- 3 Precio mínimo
- 4 Precio medio
- 5 Precio típico
- 6 Precio típico ponderado
- Desplazamiento: da un desplazamiento adicional para la señal. No debe ser superior al periodo.


In combination with 34, 68, 136 EMA, give me a good information for scalping