#define GRAPH_WIDTH 750
#define GRAPH_HEIGHT 350
#include <Graphics\Graphic.mqh>
CGraphic ExtGraph;
//+------------------------------------------------------------------+
//| Script program start function |
//+------------------------------------------------------------------+
void OnStart()
{
//--- obtenemos 9 valores de 0 a 8 con paso 1
vector X(9,VectorArange);
Print("vector X = \n",X);
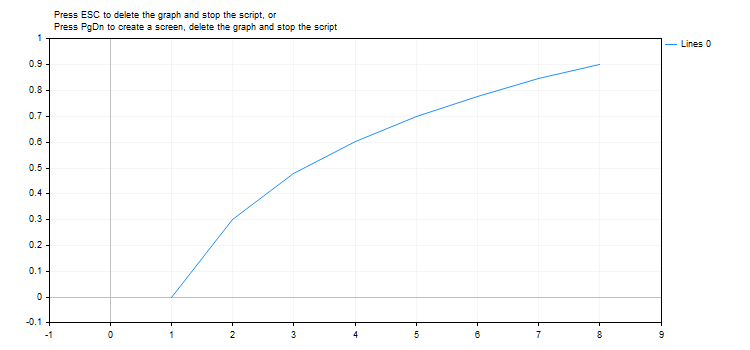
//--- calculamos el logaritmo decimal para cada valor del vector X
X=MathLog10(X);
Print("MathLog10(X) = \n",X);
//--- transferimos los valores calculados de vector a array
double y_array[];
X.Swap(y_array);
//--- dibujamos el gráfico de los valores calculados del vector
CurvePlot(y_array,clrDodgerBlue);
//--- esperamos la pulsación de Escape o PgDn para eliminar el gráfico (crear una captura de pantalla) y finalizar el funcionamiento
while(!IsStopped())
{
if(StopKeyPressed())
break;
Sleep(16);
}
//--- limpiamos
ExtGraph.Destroy();
/*
resultado:
vector X =
[0,1,2,3,4,5,6,7,8]
MathLog10(X) =
[-inf,0,0.3010299956639812,0.4771212547196624,0.6020599913279624,0.6989700043360189,0.7781512503836436,0.8450980400142568,0.9030899869919435]
*/
}
//+------------------------------------------------------------------+
//| Rellena el vector con el valor value con el incremento step |
//+------------------------------------------------------------------+
template<typename T>
void VectorArange(vector<T> &vec,T value=0.0,T step=1.0)
{
for(ulong i=0; i<vec.Size(); i++,value+=step)
vec[i]=value;
}
//+------------------------------------------------------------------+
//| Al pulsar ESC, retorna true |
//| Al pulsar PgDn hace una captura del gráfico y retorna true |
//| Si no, retorna false |
//+------------------------------------------------------------------+
bool StopKeyPressed()
{
//--- si ESC está pulsado, retornamos true
if(TerminalInfoInteger(TERMINAL_KEYSTATE_ESCAPE)!=0)
return(true);
//--- si PgDn está pulsado y se realiza correctamente la captura de pantalla, retornamos true
if(TerminalInfoInteger(TERMINAL_KEYSTATE_PAGEDOWN)!=0 && MakeAndSaveScreenshot(MQLInfoString(MQL_PROGRAM_NAME)+"_Screenshot"))
return(true);
//--- retornamos false
return(false);
}
//+------------------------------------------------------------------+
//| Crea un objeto de gráfico y dibuja una curva |
//+------------------------------------------------------------------+
void CurvePlot(double &x_array[], double &y_array[], const color colour)
{
ExtGraph.Create(ChartID(), "Graphic", 0, 0, 0, GRAPH_WIDTH, GRAPH_HEIGHT);
ExtGraph.CurveAdd(x_array, y_array, ColorToARGB(colour), CURVE_LINES);
ExtGraph.IndentUp(30);
ExtGraph.CurvePlotAll();
string text1="Press ESC to delete the graph and stop the script, or";
string text2="Press PgDn to create a screen, delete the graph and stop the script";
ExtGraph.TextAdd(54, 9, text1, ColorToARGB(clrBlack));
ExtGraph.TextAdd(54,21, text2, ColorToARGB(clrBlack));
ExtGraph.Update();
}
//+------------------------------------------------------------------+
//| Crea una captura de pantalla y guarda la imagen en un archivo |
//+------------------------------------------------------------------+
bool MakeAndSaveScreenshot(const string file_name)
{
string file_names[];
ResetLastError();
int selected=FileSelectDialog("Save Picture", NULL, "All files (*.*)|*.*", FSD_WRITE_FILE, file_names, file_name+".png");
if(selected<1)
{
if(selected<0)
PrintFormat("%s: FileSelectDialog() function returned error %d", __FUNCTION__, GetLastError());
return false;
}
bool res=false;
if(ChartSetInteger(0,CHART_SHOW,false))
res=ChartScreenShot(0, file_names[0], GRAPH_WIDTH, GRAPH_HEIGHT);
ChartSetInteger(0,CHART_SHOW,true);
return(res);
}
|