
Desarrollo de un kit de herramientas para el análisis de la acción del precio (Parte 18): Introducción a la teoría de los cuartos (III) — Quarters Board

Contenido
Introducción
En nuestra introducción a la teoría de cuartos, comenzamos con el script Quarters Drawer, que es su primer componente. Este script automatiza el dibujo de los niveles trimestrales en un gráfico y cuenta con conmutadores booleanos para controlar la visibilidad de cada nivel.
input bool   DrawLargeQuarters  = true;     // Draw intermediate large quarter lines.
input bool   DrawSmallQuarters  = false;    // Draw small quarter lines.
input bool   DrawOvershootAreas = true;     // Mark overshoot/undershoot areas for large quarter lines.
Por ejemplo, al establecer DrawSmallQuarters en true se muestran las líneas de cuartos pequeñas, mientras que al establecer DrawLargeQuarters en false se ocultan las líneas de cuartos grandes. El mismo enfoque se aplica a los niveles Overshoots y Undershoots. Esta funcionalidad le permite centrarse en niveles específicos, manteniendo el gráfico limpio y ordenado. Si quieres ver todos los niveles, simplemente activa todos los botones.
¿Alguna vez te ha resultado tedioso tener que volver a sumergirte en el código una y otra vez solo para cambiar una configuración? En este artículo, presentamos el Quarters Board, una herramienta mejorada que le permite activar o desactivar automáticamente los indicadores booleanos con solo pulsar un botón en el gráfico en tiempo real. En lugar de editar el código para cambiar el indicador DrawSmallQuarters, ahora puede realizar ajustes directamente en el gráfico, lo que agiliza el proceso para todos los traders. Por ejemplo, si solo desea ver las partes más grandes, con solo pulsar un botón lo conseguirá sin ningún problema.
Descripción general
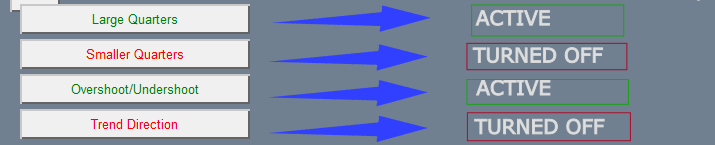
Como se mencionó en la introducción, esta herramienta le permite alternar los niveles que aparecen en el gráfico sin necesidad de volver al código para editar un indicador booleano. Quarter Board es un asesor experto que incluye cuatro botones: Large Quarters, Small Quarters, Overshoot/Undershoot y Trend Direction. Al pulsar cualquier botón se alterna su nivel correspondiente: el texto del botón se vuelve verde cuando el nivel está activo y rojo cuando está desactivado.
El botón «Trend» es una función adicional que proporciona información sobre el mercado en tiempo real. Con solo un clic, calcula una media móvil simple de 50 períodos y la compara con el precio actual del mercado, lo que le ayuda a determinar rápidamente si el mercado tiene una tendencia al alza, a la baja o lateral. El botón incluso cambia de color para mostrar su estado activo, lo que proporciona un método claro y fácil de usar para supervisar las tendencias del mercado directamente en su gráfico. Consultemos la siguiente sección para comprender la lógica central que subyace a la funcionalidad de nuestro EA.
Lógica
Este EA está diseñado para ser fácil de usar y altamente adaptable. La configuración facilita la personalización, la interfaz es limpia y bien organizada, y los controles basados en botones garantizan una interacción fluida. Al gestionar automáticamente la adición y eliminación de líneas trimestrales, el EA mantiene el gráfico ordenado y enfocado en los niveles de precios relevantes. El comentario de tendencias en vivo agrega otra capa de información, ayudando a los operadores a evaluar rápidamente la dirección del mercado sin saturar su pantalla. Con herramientas visuales y analíticas trabajando juntas, este EA simplifica las opciones comerciales y al mismo tiempo mantiene las cosas intuitivas y eficientes.
Configuración y estructura global
El EA comienza definiendo parámetros clave que determinan cómo se mostrarán los niveles de precios y los elementos del gráfico. La configuración de entrada permite a los operadores personalizar valores como el espaciado entre los principales niveles de precios y los colores utilizados para las distintas líneas. Estos ajustes proporcionan flexibilidad, permitiendo a los usuarios modificar la apariencia del EA sin cambiar su lógica central. El código también incluye varias variables booleanas globales que actúan como interruptores, permitiendo habilitar o deshabilitar funciones específicas como las líneas de cuartos grandes o los comentarios de tendencia. Las macros se utilizan para asignar nombres coherentes a los objetos del gráfico, lo que garantiza que todos los elementos se referencien de manera uniforme en todo el script. Organizar estos ajustes en un solo lugar facilita el ajuste de los parámetros y la resolución de cualquier problema sin tener que buscar en múltiples secciones del código.#property copyright "Christian Benjamin" #property link "https://www.mql5.com/en/users/lynnchris" #property version "1.0" #property strict //---- Input parameters for drawing levels ---------------------------- input double MajorStep = 0.1000; // Difference between major whole numbers //---- Color settings --------------------------------------------------- input color MajorColor = 0x2F4F4F; // Dark Slate Gray for major lines. input color LargeQuarterColor = 0x8B0000; // Dark Red for large quarter lines. input color SmallQuarterColor = 0x00008B; // Dark Blue for small quarter lines. input color OvershootColor = clrRed; // Red for overshoot/undershoot lines. //---- Line styles and thickness settings ----------------------------- input ENUM_LINE_STYLE MajorLineStyle = STYLE_SOLID; input int MajorLineWidth = 4; input ENUM_LINE_STYLE LargeQuarterLineStyle = STYLE_DOT; input int LargeQuarterLineWidth = 3; input ENUM_LINE_STYLE OvershootLineStyle = STYLE_DASH; input int OvershootLineWidth = 1; input ENUM_LINE_STYLE SmallQuarterLineStyle = STYLE_SOLID; input int SmallQuarterLineWidth = 1; //---- Panel and button settings -------------------------------------- input int PanelX = 10; input int PanelY = 10; input int PanelWidth = 250; input int ButtonHeight = 30; input int ButtonSpacing= 5; //---- Global toggle variables ---------------------------------------- bool g_DrawLargeQuarters = true; bool g_DrawSmallQuarters = false; bool g_DrawOvershootAreas = true; bool g_DrawTrendDirection = false; //---- Object names for panel and buttons ----------------------------- #define PANEL_NAME "LevelsPanel" #define BUTTON_LARGE "btnLargeQuarters" #define BUTTON_SMALL "btnSmallQuarters" #define BUTTON_OVERSHOOT "btnOvershoot" #define BUTTON_TREND "btnTrendDirection" #define TREND_LABEL "TrendDirectionLabel"
Inicialización del panel y los botones
Una vez establecida la configuración, el EA construye la interfaz de usuario. Se crea un panel de fondo para agrupar todos los botones, proporcionando un diseño estructurado. El panel se simula utilizando una etiqueta rectangular, cuyas dimensiones se ajustan modificando las propiedades del texto. A continuación, los botones se colocan en relación con el panel, asegurando un espaciado y una alineación adecuados.
Estos botones permiten a los operadores alternar entre funciones como cuartos grandes, cuartos pequeños, áreas overshoot y comentarios sobre la dirección de la tendencia. A cada botón se le asigna un ancho y alto uniformes, lo que crea un aspecto limpio y organizado. La configuración facilita a los usuarios la interacción con el EA, ya que pueden activar o desactivar elementos específicos con un solo clic. Al mantener un diseño uniforme, el EA garantiza que todos los controles sean fácilmente accesibles y visualmente distintos.
void CreatePanel()
  {
   if(ObjectCreate(0, PANEL_NAME, OBJ_RECTANGLE_LABEL, 0, 0, 0))
     {
      ObjectSetInteger(0, PANEL_NAME, OBJPROP_CORNER, CORNER_LEFT_UPPER);
      ObjectSetInteger(0, PANEL_NAME, OBJPROP_XDISTANCE, PanelX);
      ObjectSetInteger(0, PANEL_NAME, OBJPROP_YDISTANCE, PanelY);
      ObjectSetInteger(0, PANEL_NAME, OBJPROP_COLOR, clrDarkGray);
      ObjectSetString(0, PANEL_NAME, OBJPROP_TEXT, "\n\n\n\n");
      ObjectSetInteger(0, PANEL_NAME, OBJPROP_BORDER_TYPE, BORDER_RAISED);
     }
  }
Manejo de interacciones con el usuario
La interacción del usuario es un aspecto crucial del EA, gestionado a través de un sistema de gestión de eventos. El script escucha los eventos del gráfico, comprobando específicamente si se ha pulsado un botón. Cuando se pulsa un botón, el sistema identifica qué función debe activarse haciendo coincidir el nombre del botón. Una vez identificada, la función correspondiente se activa o desactiva. Por ejemplo, al pulsar el botón "Large Quarters" se alterna entre mostrar y ocultar esos niveles de precios.
Para mejorar la experiencia del usuario, los colores de los botones se actualizan inmediatamente, lo que proporciona una respuesta visual clara: los botones activos pueden volverse verdes, mientras que los inactivos permanecen rojos. Este sistema garantiza que cada función funcione de forma independiente, evitando conflictos y haciendo que la herramienta responda a la entrada del usuario en tiempo real. Al estructurar eficientemente el manejo de eventos, el EA permanece estable y fácil de usar, incluso en condiciones de mercado de ritmo rápido.
void OnChartEvent(const int id,
                  const long &lparam,
                  const double &dparam,
                  const string &sparam)
  {
   if(id == CHARTEVENT_OBJECT_CLICK)
     {
      if(sparam == BUTTON_LARGE)
        {
         g_DrawLargeQuarters = !g_DrawLargeQuarters;
         UpdateButtonColors();
         DrawQuarterLines();
        }
      else if(sparam == BUTTON_TREND)
        {
         g_DrawTrendDirection = !g_DrawTrendDirection;
         UpdateButtonColors();
         if(g_DrawTrendDirection)
            UpdateTrendComment();
         else
            DeleteTrendComment();
        }
      // Similar handling for other buttons...
     }
  }
Dibujar y eliminar líneas de cuartos
Una de las funciones principales del EA es trazar los niveles de precios en el gráfico. El proceso comienza determinando el precio actual de mercado y calculando los límites de precios clave. Los niveles principales siempre se dibujan, mientras que los niveles adicionales, como cuartos grandes, cuartos pequeños y zonas de sobrepaso, solo se muestran si sus respectivos botones están habilitados. Para mantener el gráfico limpio, el EA primero elimina cualquier línea dibujada anteriormente antes de colocar otras nuevas.
Esto evita que las líneas superpuestas u obsoletas saturen la pantalla. Cada método de fraccionamiento sigue un cálculo estructurado, lo que garantiza que los niveles de precios se alineen correctamente. Si una función está desactivada, el script elimina las líneas correspondientes, lo que permite a los operadores tener un control total sobre lo que se muestra. Este enfoque garantiza que el gráfico permanezca organizado y proporcione solo la información más relevante en función de las preferencias del usuario.
void DrawQuarterLines()
  {
   DeleteQuarterLines();
   double currentPrice = SymbolInfoDouble(_Symbol, SYMBOL_BID);
   double lowerMajor = MathFloor(currentPrice / MajorStep) * MajorStep;
   DrawHorizontalLine("MajorLower", lowerMajor, MajorColor, MajorLineWidth, MajorLineStyle);
   if(g_DrawLargeQuarters)
     {
      double LQIncrement = MajorStep / 4.0;
      for(int i = 1; i < 4; i++)
        {
         double level = lowerMajor + i * LQIncrement;
         DrawHorizontalLine("LargeQuarter_" + IntegerToString(i), level, LargeQuarterColor, LargeQuarterLineWidth, LargeQuarterLineStyle);
         // Overshoot/Undershoot handling...
        }
     }
   // Additional code for small quarters...
  }
Visualización de comentarios sobre tendencias
Más allá de los elementos gráficos, el EA también proporciona a los traders un análisis textual de las tendencias del mercado. Calcula una media móvil simple (SMA) durante un período definido y la compara con el precio actual. Si el precio está por encima de la media móvil simple (SMA), la tendencia se considera alcista; si está por debajo, la tendencia es bajista. Si hay poco movimiento alrededor de la media móvil simple (SMA), el mercado se clasifica como neutral. Este análisis se muestra como una etiqueta de texto en el gráfico, ubicada justo debajo del botón Dirección de tendencia para garantizar la visibilidad sin interferir con otros elementos. El comentario se actualiza dinámicamente, proporcionando información en tiempo real a medida que evolucionan las condiciones del mercado. Esta función complementa el sistema de cuarteo gráfico al brindarles a los comerciantes una capa adicional de análisis, ayudándolos a tomar decisiones más informadas.
void UpdateTrendComment()
  {
   double currentPrice = SymbolInfoDouble(_Symbol, SYMBOL_BID);
   double smaValue = 0.0;
   int handle = iMA(_Symbol, PERIOD_CURRENT, 50, 0, MODE_SMA, PRICE_CLOSE);
   if(handle != INVALID_HANDLE)
     {
      double buffer[];
      if(CopyBuffer(handle, 0, 1, 1, buffer) > 0)
         smaValue = buffer[0];
      IndicatorRelease(handle);
     }
   string trendComment = (currentPrice > smaValue) ? "Uptrend" :
                         (currentPrice < smaValue) ? "Downtrend" : "Sideways";

   int trendLabelY = PanelY + 10 + 3 * (ButtonHeight + ButtonSpacing) + ButtonHeight + ButtonSpacing;
   if(ObjectFind(0, TREND_LABEL) == -1)
     {
      ObjectCreate(0, TREND_LABEL, OBJ_LABEL, 0, 0, 0);
      ObjectSetInteger(0, TREND_LABEL, OBJPROP_CORNER, CORNER_LEFT_UPPER);
      ObjectSetInteger(0, TREND_LABEL, OBJPROP_XDISTANCE, PanelX + 10);
      ObjectSetInteger(0, TREND_LABEL, OBJPROP_YDISTANCE, trendLabelY);
      ObjectSetInteger(0, TREND_LABEL, OBJPROP_COLOR, clrWhite);
      ObjectSetInteger(0, TREND_LABEL, OBJPROP_FONTSIZE, 14);
     }
   ObjectSetString(0, TREND_LABEL, OBJPROP_TEXT, "Trend Direction: " + trendComment);
  }
Código completo del EA
//+------------------------------------------------------------------+
//|                                             Quarters Board EA.mq5|
//|                                Copyright 2025, Christian Benjamin|
//|                           https://www.mql5.com/en/users/lynnchris|
//+------------------------------------------------------------------+
#property copyright "Christian Benjamin"
#property link      "https://www.mql5.com/en/users/lynnchris"
#property version   "1.0"
#property strict

//---- Input parameters for drawing levels ----------------------------
input double MajorStep = 0.1000;   // Difference between major whole numbers

//---- Color settings ---------------------------------------------------
input color  MajorColor         = 0x2F4F4F; // Dark Slate Gray for major lines.
input color  LargeQuarterColor  = 0x8B0000; // Dark Red for large quarter lines.
input color  SmallQuarterColor  = 0x00008B; // Dark Blue for small quarter lines.
input color  OvershootColor     = clrRed;   // Red for overshoot/undershoot lines.

//---- Line styles and thickness settings -----------------------------
input ENUM_LINE_STYLE MajorLineStyle       = STYLE_SOLID;
input int    MajorLineWidth                 = 4;
input ENUM_LINE_STYLE LargeQuarterLineStyle  = STYLE_DOT;
input int    LargeQuarterLineWidth          = 3;
input ENUM_LINE_STYLE OvershootLineStyle     = STYLE_DASH;
input int    OvershootLineWidth             = 1;
input ENUM_LINE_STYLE SmallQuarterLineStyle  = STYLE_SOLID;
input int    SmallQuarterLineWidth          = 1;

//---- Panel and button settings --------------------------------------
input int PanelX       = 10;
input int PanelY       = 10;
input int PanelWidth   = 250;
input int ButtonHeight = 30;
input int ButtonSpacing= 5;

//---- Global toggle variables ----------------------------------------
bool g_DrawLargeQuarters   = true;
bool g_DrawSmallQuarters   = false;
bool g_DrawOvershootAreas  = true;
bool g_DrawTrendDirection  = false;

//---- Object names for panel and buttons -----------------------------
#define PANEL_NAME       "LevelsPanel"
#define BUTTON_LARGE     "btnLargeQuarters"
#define BUTTON_SMALL     "btnSmallQuarters"
#define BUTTON_OVERSHOOT "btnOvershoot"
#define BUTTON_TREND     "btnTrendDirection"
#define TREND_LABEL      "TrendDirectionLabel"

//+------------------------------------------------------------------+
//| Expert initialization function                                   |
//+------------------------------------------------------------------+
int OnInit()
  {
// Create panel background and buttons
   CreatePanel();
   CreateButtons();
// Draw quarter lines initially
   DrawQuarterLines();
// If trend commentary is toggled on, update it
   if(g_DrawTrendDirection)
      UpdateTrendComment();
   return(INIT_SUCCEEDED);
  }
//+------------------------------------------------------------------+
//| Expert deinitialization function                                 |
//+------------------------------------------------------------------+
void OnDeinit(const int reason)
  {
// Delete panel, buttons, quarter lines, and trend commentary
   ObjectDelete(0, PANEL_NAME);
   ObjectDelete(0, BUTTON_LARGE);
   ObjectDelete(0, BUTTON_SMALL);
   ObjectDelete(0, BUTTON_OVERSHOOT);
   ObjectDelete(0, BUTTON_TREND);
   DeleteQuarterLines();
   DeleteTrendComment();
  }
//+------------------------------------------------------------------+
//| Expert tick function                                             |
//+------------------------------------------------------------------+
void OnTick()
  {
// Redraw quarter lines on every tick
   DrawQuarterLines();
// Update trend commentary if enabled
   if(g_DrawTrendDirection)
      UpdateTrendComment();
  }
//+------------------------------------------------------------------+
//| Chart event function to catch button clicks                      |
//+------------------------------------------------------------------+
void OnChartEvent(const int id,
                  const long &lparam,
                  const double &dparam,
                  const string &sparam)
  {
   if(id == CHARTEVENT_OBJECT_CLICK)
     {
      if(sparam == BUTTON_LARGE)
        {
         g_DrawLargeQuarters = !g_DrawLargeQuarters;
         UpdateButtonColors();
         DrawQuarterLines();
        }
      else
         if(sparam == BUTTON_SMALL)
           {
            g_DrawSmallQuarters = !g_DrawSmallQuarters;
            UpdateButtonColors();
            DrawQuarterLines();
           }
         else
            if(sparam == BUTTON_OVERSHOOT)
              {
               g_DrawOvershootAreas = !g_DrawOvershootAreas;
               UpdateButtonColors();
               DrawQuarterLines();
              }
            else
               if(sparam == BUTTON_TREND)
                 {
                  g_DrawTrendDirection = !g_DrawTrendDirection;
                  UpdateButtonColors();
                  if(g_DrawTrendDirection)
                     UpdateTrendComment();
                  else
                     DeleteTrendComment();
                 }
     }
  }
//+------------------------------------------------------------------+
//| Create panel background                                          |
//+------------------------------------------------------------------+
void CreatePanel()
  {
   if(ObjectCreate(0, PANEL_NAME, OBJ_RECTANGLE_LABEL, 0, 0, 0))
     {
      ObjectSetInteger(0, PANEL_NAME, OBJPROP_CORNER, CORNER_LEFT_UPPER);
      ObjectSetInteger(0, PANEL_NAME, OBJPROP_XDISTANCE, PanelX);
      ObjectSetInteger(0, PANEL_NAME, OBJPROP_YDISTANCE, PanelY);
      ObjectSetInteger(0, PANEL_NAME, OBJPROP_COLOR, clrDarkGray);
      // Simulate a larger panel using newlines in the text.
      string panelText = "\n\n\n\n";
      ObjectSetString(0, PANEL_NAME, OBJPROP_TEXT, panelText);
      ObjectSetInteger(0, PANEL_NAME, OBJPROP_BORDER_TYPE, BORDER_RAISED);
     }
  }
//+------------------------------------------------------------------+
//| Create buttons on the panel                                      |
//+------------------------------------------------------------------+
void CreateButtons()
  {
   int x = PanelX + 10;
   int y = PanelY + 10;
   int btnWidth = PanelWidth - 20;
// Button for Large Quarters
   if(!ObjectCreate(0, BUTTON_LARGE, OBJ_BUTTON, 0, 0, 0))
      Print("Failed to create button ", BUTTON_LARGE);
   else
     {
      ObjectSetInteger(0, BUTTON_LARGE, OBJPROP_CORNER, CORNER_LEFT_UPPER);
      ObjectSetInteger(0, BUTTON_LARGE, OBJPROP_XDISTANCE, x);
      ObjectSetInteger(0, BUTTON_LARGE, OBJPROP_YDISTANCE, y);
      ObjectSetInteger(0, BUTTON_LARGE, OBJPROP_XSIZE, btnWidth);
      ObjectSetInteger(0, BUTTON_LARGE, OBJPROP_YSIZE, ButtonHeight);
      ObjectSetString(0, BUTTON_LARGE, OBJPROP_TEXT, "Large Quarters");
     }
// Button for Smaller Quarters
   y += ButtonHeight + ButtonSpacing;
   if(!ObjectCreate(0, BUTTON_SMALL, OBJ_BUTTON, 0, 0, 0))
      Print("Failed to create button ", BUTTON_SMALL);
   else
     {
      ObjectSetInteger(0, BUTTON_SMALL, OBJPROP_CORNER, CORNER_LEFT_UPPER);
      ObjectSetInteger(0, BUTTON_SMALL, OBJPROP_XDISTANCE, x);
      ObjectSetInteger(0, BUTTON_SMALL, OBJPROP_YDISTANCE, y);
      ObjectSetInteger(0, BUTTON_SMALL, OBJPROP_XSIZE, btnWidth);
      ObjectSetInteger(0, BUTTON_SMALL, OBJPROP_YSIZE, ButtonHeight);
      ObjectSetString(0, BUTTON_SMALL, OBJPROP_TEXT, "Smaller Quarters");
     }
// Button for Overshoot/Undershoot
   y += ButtonHeight + ButtonSpacing;
   if(!ObjectCreate(0, BUTTON_OVERSHOOT, OBJ_BUTTON, 0, 0, 0))
      Print("Failed to create button ", BUTTON_OVERSHOOT);
   else
     {
      ObjectSetInteger(0, BUTTON_OVERSHOOT, OBJPROP_CORNER, CORNER_LEFT_UPPER);
      ObjectSetInteger(0, BUTTON_OVERSHOOT, OBJPROP_XDISTANCE, x);
      ObjectSetInteger(0, BUTTON_OVERSHOOT, OBJPROP_YDISTANCE, y);
      ObjectSetInteger(0, BUTTON_OVERSHOOT, OBJPROP_XSIZE, btnWidth);
      ObjectSetInteger(0, BUTTON_OVERSHOOT, OBJPROP_YSIZE, ButtonHeight);
      ObjectSetString(0, BUTTON_OVERSHOOT, OBJPROP_TEXT, "Overshoot/Undershoot");
     }
// Button for Trend Direction
   y += ButtonHeight + ButtonSpacing;
   if(!ObjectCreate(0, BUTTON_TREND, OBJ_BUTTON, 0, 0, 0))
      Print("Failed to create button ", BUTTON_TREND);
   else
     {
      ObjectSetInteger(0, BUTTON_TREND, OBJPROP_CORNER, CORNER_LEFT_UPPER);
      ObjectSetInteger(0, BUTTON_TREND, OBJPROP_XDISTANCE, x);
      ObjectSetInteger(0, BUTTON_TREND, OBJPROP_YDISTANCE, y);
      ObjectSetInteger(0, BUTTON_TREND, OBJPROP_XSIZE, btnWidth);
      ObjectSetInteger(0, BUTTON_TREND, OBJPROP_YSIZE, ButtonHeight);
      ObjectSetString(0, BUTTON_TREND, OBJPROP_TEXT, "Trend Direction");
     }
   UpdateButtonColors();
  }
//+------------------------------------------------------------------+
//| Update button colors based on toggle state                       |
//+------------------------------------------------------------------+
void UpdateButtonColors()
  {
   color onColor  = clrGreen;
   color offColor = clrRed;
   ObjectSetInteger(0, BUTTON_LARGE,     OBJPROP_COLOR, g_DrawLargeQuarters  ? onColor : offColor);
   ObjectSetInteger(0, BUTTON_SMALL,     OBJPROP_COLOR, g_DrawSmallQuarters  ? onColor : offColor);
   ObjectSetInteger(0, BUTTON_OVERSHOOT, OBJPROP_COLOR, g_DrawOvershootAreas ? onColor : offColor);
   ObjectSetInteger(0, BUTTON_TREND,     OBJPROP_COLOR, g_DrawTrendDirection ? onColor : offColor);
  }
//+------------------------------------------------------------------+
//| Delete quarter lines                                             |
//+------------------------------------------------------------------+
void DeleteQuarterLines()
  {
   ObjectDelete(0, "MajorLower");
   ObjectDelete(0, "MajorUpper");
   for(int i = 1; i < 4; i++)
     {
      ObjectDelete(0, "LargeQuarter_" + IntegerToString(i));
      ObjectDelete(0, "Overshoot_" + IntegerToString(i) + "_up");
      ObjectDelete(0, "Undershoot_" + IntegerToString(i) + "_down");
     }
   for(int seg = 0; seg < 10; seg++)
     {
      for(int j = 1; j < 4; j++)
        {
         ObjectDelete(0, "SmallQuarter_" + IntegerToString(seg) + "_" + IntegerToString(j));
        }
     }
  }
//+------------------------------------------------------------------+
//| Delete trend commentary                                          |
//+------------------------------------------------------------------+
void DeleteTrendComment()
  {
   ObjectDelete(0, TREND_LABEL);
  }
//+------------------------------------------------------------------+
//| Update trend commentary                                          |
//+------------------------------------------------------------------+
void UpdateTrendComment()
  {
   double currentPrice = SymbolInfoDouble(_Symbol, SYMBOL_BID);
   if(currentPrice == 0)
      return;
   double smaValue = 0.0;
   double buffer[];
   int handle = iMA(_Symbol, PERIOD_CURRENT, 50, 0, MODE_SMA, PRICE_CLOSE);
   if(handle != INVALID_HANDLE)
     {
      if(CopyBuffer(handle, 0, 1, 1, buffer) > 0)
         smaValue = buffer[0];
      IndicatorRelease(handle);
     }
   string trendComment;
   if(currentPrice > smaValue)
      trendComment = "Uptrend";
   else
      if(currentPrice < smaValue)
         trendComment = "Downtrend";
      else
         trendComment = "Sideways";

// Calculate the position for the commentary label below the Trend Direction button
   int trendButtonY = PanelY + 10 + 3 * (ButtonHeight + ButtonSpacing);
   int trendLabelY = trendButtonY + ButtonHeight + ButtonSpacing;
   int trendLabelX = PanelX + 10;

   if(ObjectFind(0, TREND_LABEL) == -1)
     {
      ObjectCreate(0, TREND_LABEL, OBJ_LABEL, 0, 0, 0);
      ObjectSetInteger(0, TREND_LABEL, OBJPROP_CORNER, CORNER_LEFT_UPPER);
      ObjectSetInteger(0, TREND_LABEL, OBJPROP_XDISTANCE, trendLabelX);
      ObjectSetInteger(0, TREND_LABEL, OBJPROP_YDISTANCE, trendLabelY);
      ObjectSetInteger(0, TREND_LABEL, OBJPROP_COLOR, clrWhite);
      ObjectSetInteger(0, TREND_LABEL, OBJPROP_FONTSIZE, 14);
     }
   string txt = "Trend Direction: " + trendComment;
   ObjectSetString(0, TREND_LABEL, OBJPROP_TEXT, txt);
  }
//+------------------------------------------------------------------+
//| Draw horizontal line utility                                     |
//+------------------------------------------------------------------+
void DrawHorizontalLine(string name, double price, color lineColor, int width, ENUM_LINE_STYLE style)
  {
   if(ObjectFind(0, name) != -1)
      ObjectDelete(0, name);
   if(!ObjectCreate(0, name, OBJ_HLINE, 0, 0, price))
     {
      Print("Failed to create line: ", name);
      return;
     }
   ObjectSetInteger(0, name, OBJPROP_COLOR, lineColor);
   ObjectSetInteger(0, name, OBJPROP_STYLE, style);
   ObjectSetInteger(0, name, OBJPROP_WIDTH, width);
   ObjectSetInteger(0, name, OBJPROP_RAY_RIGHT, true);
  }
//+------------------------------------------------------------------+
//| Draw quarter lines based on toggle settings                      |
//+------------------------------------------------------------------+
void DrawQuarterLines()
  {
   DeleteQuarterLines();
   double currentPrice = SymbolInfoDouble(_Symbol, SYMBOL_BID);
   if(currentPrice == 0)
      return;
   double lowerMajor = MathFloor(currentPrice / MajorStep) * MajorStep;
   double upperMajor = lowerMajor + MajorStep;
   DrawHorizontalLine("MajorLower", lowerMajor, MajorColor, MajorLineWidth, MajorLineStyle);
   DrawHorizontalLine("MajorUpper", upperMajor, MajorColor, MajorLineWidth, MajorLineStyle);
   if(g_DrawLargeQuarters)
     {
      double LQIncrement = MajorStep / 4.0;
      for(int i = 1; i < 4; i++)
        {
         double level = lowerMajor + i * LQIncrement;
         string objName = "LargeQuarter_" + IntegerToString(i);
         DrawHorizontalLine(objName, level, LargeQuarterColor, LargeQuarterLineWidth, LargeQuarterLineStyle);
         if(g_DrawOvershootAreas)
           {
            double smallQuarter = MajorStep / 40.0;
            DrawHorizontalLine("Overshoot_" + IntegerToString(i) + "_up", level + smallQuarter, OvershootColor, OvershootLineWidth, OvershootLineStyle);
            DrawHorizontalLine("Undershoot_" + IntegerToString(i) + "_down", level - smallQuarter, OvershootColor, OvershootLineWidth, OvershootLineStyle);
           }
        }
     }
   if(g_DrawSmallQuarters)
     {
      double segStep = MajorStep / 10.0;
      double smallQuarter = segStep / 4.0;
      for(int seg = 0; seg < 10; seg++)
        {
         double segStart = lowerMajor + seg * segStep;
         for(int j = 1; j < 4; j++)
           {
            double level = segStart + j * smallQuarter;
            string objName = "SmallQuarter_" + IntegerToString(seg) + "_" + IntegerToString(j);
            DrawHorizontalLine(objName, level, SmallQuarterColor, SmallQuarterLineWidth, SmallQuarterLineStyle);
           }
        }
     }
  }
//+------------------------------------------------------------------+
Resultados
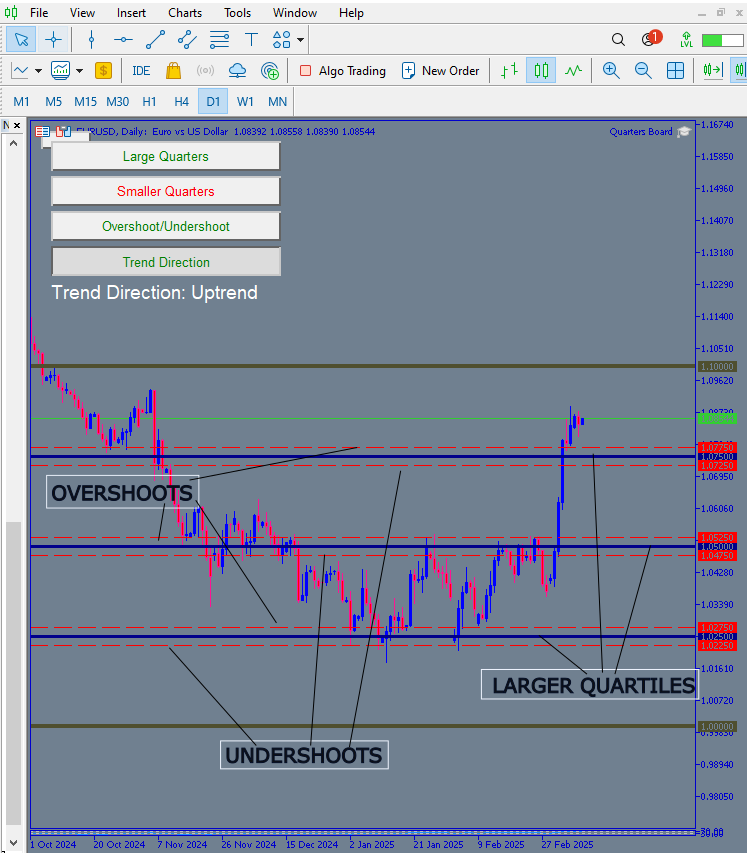
En esta sección examinamos los resultados y el rendimiento de nuestro EA. A continuación se muestra un diagrama GIF que ilustra su comportamiento. Cuando se arrastra el EA a un gráfico EURUSD, aparece un panel con botones. Inicialmente, los botones «Larger Quarter» y «Overshoot/Undershoot» muestran texto en verde, lo que indica que están desactivados. Por el contrario, los botones «Smaller Quarters» y «Trend Direction» muestran texto en rojo, lo que significa que estos niveles están activos. Al pulsar cada botón, se pueden ver los niveles correspondientes aparecer en el gráfico cuando se activan, o desaparecer cuando se desactivan. Cabe destacar que, tras activar el botón «Trend Direction», el comentario sobre la tendencia se actualiza para mostrar «Uptrend», lo que refleja con precisión la situación actual del mercado en el gráfico.

A continuación se muestra un diagrama que muestra claramente los resultados de las pruebas realizadas con nuestro EA. Podemos ver que los niveles de cuarto grande, representados por líneas sólidas azules, y los niveles de sobreimpulso/subimpulso, representados por líneas discontinuas rojas, están activos, como lo evidencian las líneas del gráfico y el color del texto del botón. Además, la dirección de la tendencia está activa, como lo muestra el comentario visible en el gráfico. Por el contrario, el botón de cuartos pequeños aparece en rojo, lo que indica que esos niveles no están activos.
Conclusión
Habiendo introducido el artículo con el objetivo de crear un panel con botones que alternen los niveles requeridos en el gráfico con una sola pulsación, ya sea inicializándolos o desinicializándolos, hemos logrado con éxito ese objetivo. Esto representa otro paso adelante en el manejo de los niveles trimestrales según los requisitos de los traders. La mejora proporciona una interfaz fácil de usar: a veces es posible que desees concentrarte únicamente en áreas grandes sin interferencias de otros niveles, mientras que en otras ocasiones es posible que prefieras mostrar todos los niveles. Además, esta herramienta ofrece análisis de dirección de tendencias para ayudarle a comprender qué está sucediendo realmente en el mercado en función del precio actual.
| Fecha | Nombre de la herramienta | Descripción | Versión | Actualizaciones | Notas |
|---|---|---|---|---|---|
| 01/10/24 | Chart Projector | Script para superponer la acción del precio del día anterior con efecto fantasma. | 1.0 | Primera publicación | Herramienta 1 |
| 18/11/24 | Analytical Comment | Proporciona información del día anterior en formato tabular y anticipa la dirección futura del mercado. | 1.0 | Primera publicación | Herramienta 2 |
| 27/11/24 | Analytics Master | Actualización periódica de las métricas del mercado cada dos horas. | 1.01 | Segunda publicación | Herramienta 3 |
| 02/12/24 | Analytics Forecaster | Actualización periódica de las métricas del mercado cada dos horas con integración de Telegram. | 1.1 | Tercera edición | Herramienta 4 |
| 09/12/24 | Volatility Navigator | EA que analiza las condiciones del mercado utilizando los indicadores Bandas de Bollinger, RSI y ATR. | 1.0 | Primera publicación | Herramienta 5 |
| 19/12/24 | Mean Reversion Signal Reaper | Analiza el mercado utilizando la estrategia de reversión a la media y proporciona señales. | 1.0 | Primera publicación | Herramienta 6 |
| 09/01/25 | Signal Pulse | Analizador de múltiples marcos temporales. | 1.0 | Primera publicación | Herramienta 7 |
| 17/01/25 | Metrics Board | Panel con botón para análisis. | 1.0 | Primera publicación | Herramienta 8 |
| 21/01/25 | External Flow | Análisis a través de bibliotecas externas. | 1.0 | Primera publicación | Herramienta 9 |
| 27/01/25 | VWAP | Volume Weighted Average Price | 1.3 | Primera publicación | Herramienta 10 |
| 02/02/25 | Heikin Ashi | Identificación de señales de suavizado y reversión de tendencias. | 1.0 | Primera publicación | Herramienta 11 |
| 04/02/25 | FibVWAP | Generación de señales mediante análisis de Python. | 1.0 | Primera publicación | Herramienta 12 |
| 14/02/25 | RSI DIVERGENCE | Acción del precio frente a divergencias del RSI. | 1.0 | Primera publicación | Herramienta 13 |
| 17/02/25 | Parabolic Stop and Reverse (PSAR) | Automatización de la estrategia PSAR. | 1.0 | Primera publicación | Herramienta 14 |
| 20/02/25 | Quarters Drawer Script | Traza los niveles de cuartos en el gráfico. | 1.0 | Primera publicación | Herramienta 15 |
| 27/02/25 | Intrusion Detector | Detectar y alertar cuando el precio alcance niveles de cuartos. | 1.0 | Primera publicación | Herramienta 16 |
| 27/02/25 | TrendLoom Tool | Panel de análisis de múltiples marcos temporales. | 1.0 | Primera publicación | Herramienta 17 |
| 11/03/25 | Quarters Board | Panel con botones para activar o desactivar los niveles de cuartos. | 1.0 | Primera publicación | Herramienta 18 |
Traducción del inglés realizada por MetaQuotes Ltd.
Artículo original: https://www.mql5.com/en/articles/17442
Advertencia: todos los derechos de estos materiales pertenecen a MetaQuotes Ltd. Queda totalmente prohibido el copiado total o parcial.
Este artículo ha sido escrito por un usuario del sitio web y refleja su punto de vista personal. MetaQuotes Ltd. no se responsabiliza de la exactitud de la información ofrecida, ni de las posibles consecuencias del uso de las soluciones, estrategias o recomendaciones descritas.

- Aplicaciones de trading gratuitas
- 8 000+ señales para copiar
- Noticias económicas para analizar los mercados financieros
Usted acepta la política del sitio web y las condiciones de uso