Session Flow Board
- Indicators
-
Istvan Balazsa
 Futures and Forex day trader. Pre-market levels + a no-BS market read for NQ & DAX every session — pivots, S/R, bias. -> https://www.GekkQuant.com/ The tape doesn't hand out free money.
 - Version: 1.0
- Activations: 5
Session Flow Board
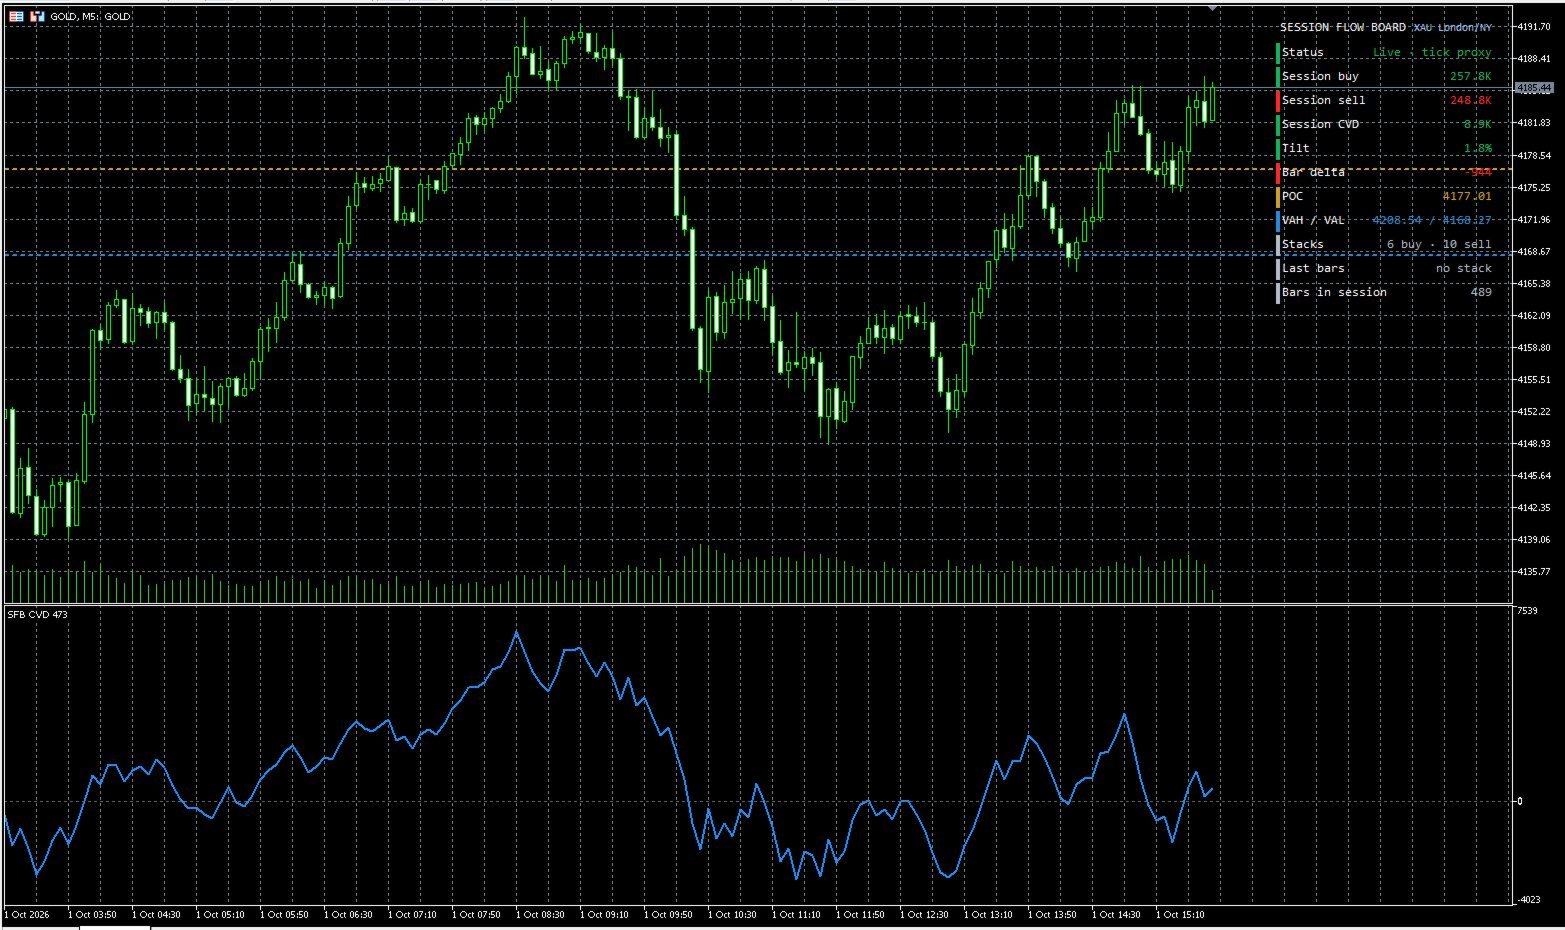
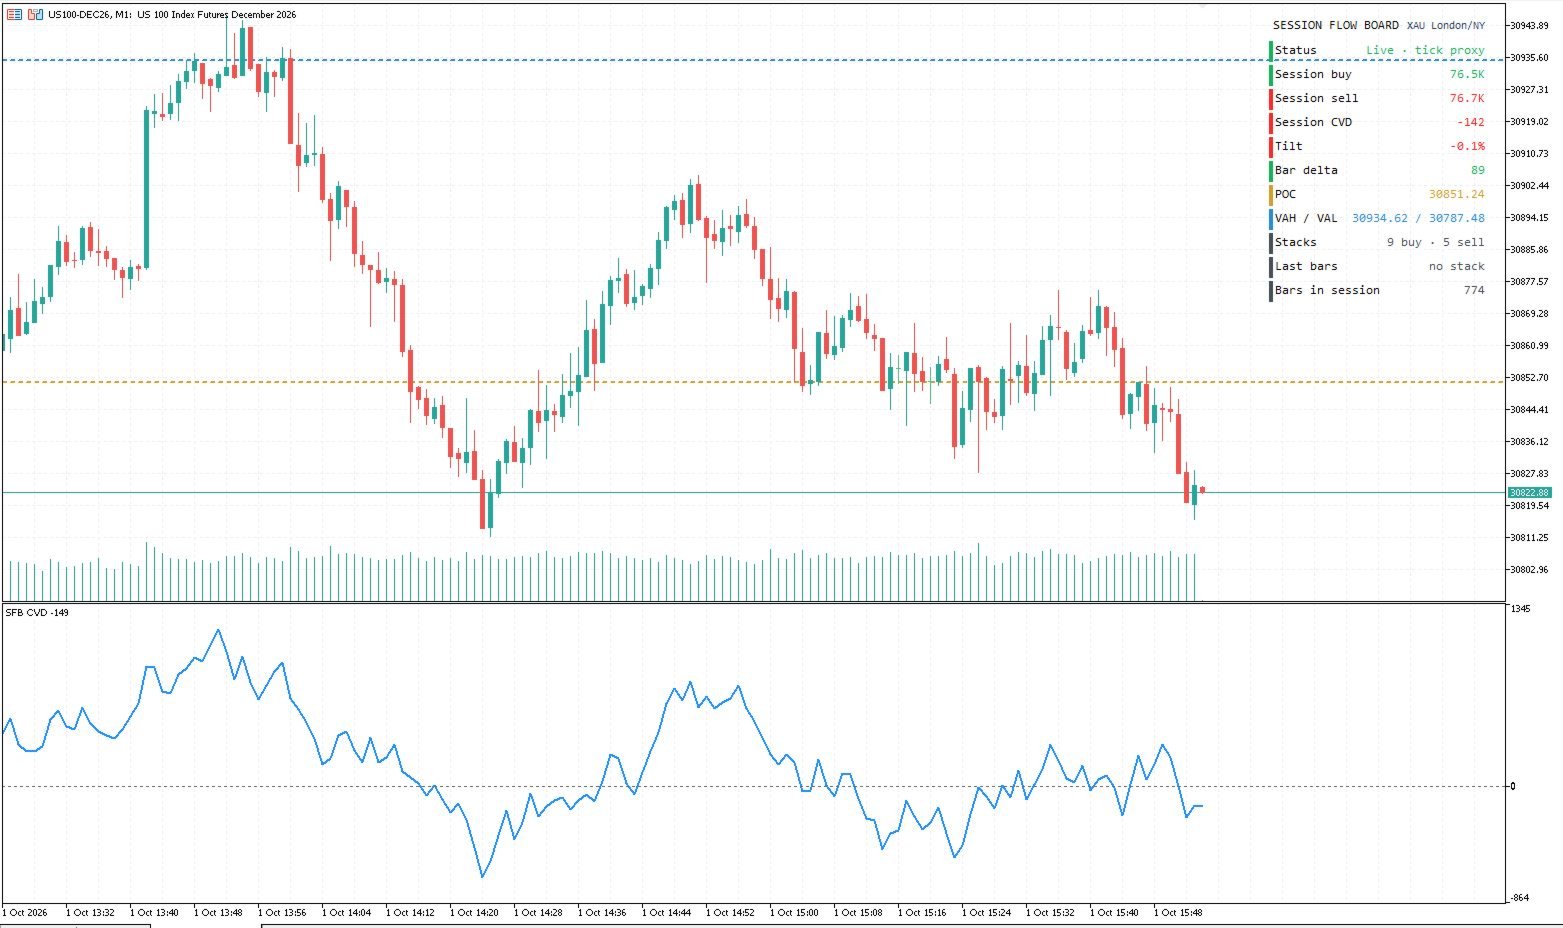
A session scoreboard for XAUUSD and NAS100. One glance tells you who has been leaning on the session: buyers, sellers, or neither.
It splits session tick volume into a buy proxy and a sell proxy from where each bar closed inside its range. Close near the high, the bar counts more as buy. Close near the low, more as sell. That running difference is the session CVD.
What you see
- Session buy and session sell
- Session CVD and the last closed bar's delta
- Tilt, in percent
- POC, VAH and VAL, on the panel and as dashed lines
- Stacked one-sided bars
- A blue Session CVD line in its own window, reset outside the session
What it does not do
- No buy or sell arrows
- No orders
- No entries, no exits, no promises
The status line reads Live · tick proxy while the session is open. On a CFD this is tick volume, not bid/ask volume. If the symbol sends none, the panel says NO TICK VOLUME.
How to read it
Draw one reference line. Yesterday's low, the cash open, or the London high. Wait until a closed candle prints on that line. Then read four cells: session buy, session sell, CVD, and Last bars.
Buyers in control looks like this: session buy ahead of session sell, CVD and tilt green, Last bars on STACK buy, the CVD line rising, price holding above the gold POC.
A new high with falling CVD is a warning, not an entry. Price can print a higher high while session sell leads, tilt is red, and Last bars shows STACK sell. The mirror case is a lower low with CVD rising.
Presets cover XAU London/NY and NAS100 cash. Custom takes a session as HH:MM-HH:MM, server time. Labels follow the chart: white on a dark background, black on a light one.
A full user guide comes with the product. It walks through install, every panel line, the settings, and both of those scenarios with pictures.
Not a strategy. Not financial advice.