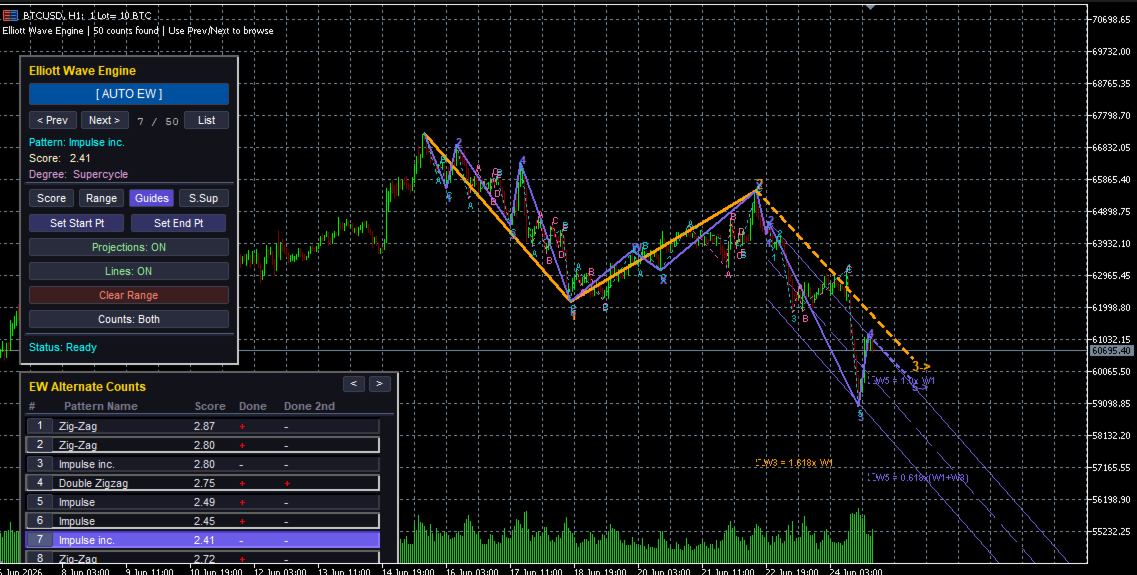
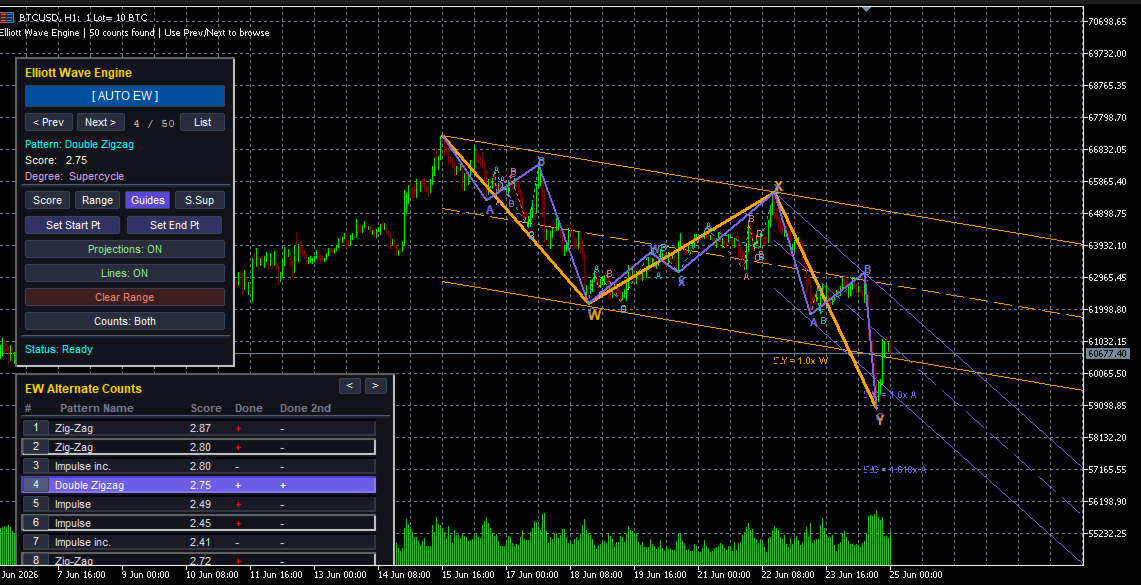
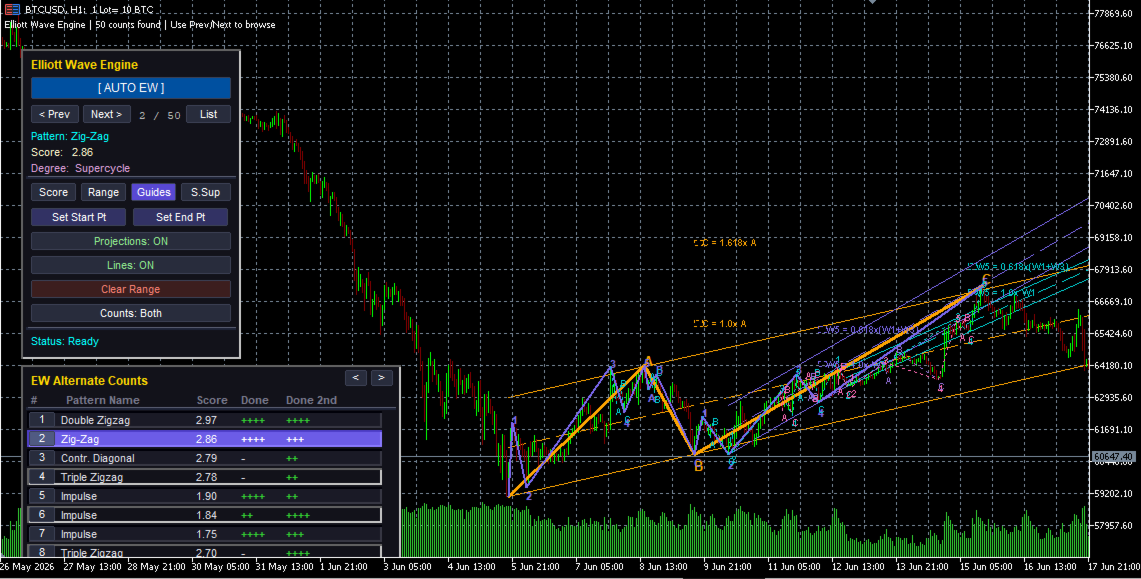
Elliott Wave Engine

Elliott Wave Engine

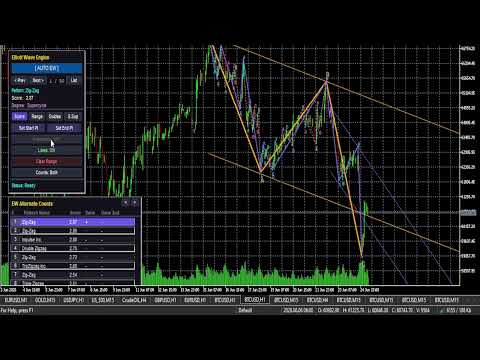
The Auto Elliott Engine is a tool designed for MetaTrader 5 that automates the identification, decomposition, and projection of price structures based on the Elliott Wave Theory.

Powered by a pattern-recognition engine, this indicator processes price action to identify market configurations, translating data into structured scenarios.

Key Features
  • Multi-Degree Recognition: Analyzes price action across multiple fractal levels. From higher degrees, such as Supercycle or Cycle, down to minor structures.

  • Pattern Decoder: Identifies impulsive formations (Standard Impulses, Contractive/Expanding Diagonals) and corrective patterns (Simple and Complex Zig-Zags, Regular/Expanded Flats, Triangles, and WXY/WXYXZ Combinations).

  • Fibonacci Projections: The system projects retracement and extension zones on the chart based on the active wave. The interface allows for toggling between visualizing key areas of the last wave or a mapping of all calculated ranges.

  • Scoring System: Each suggested count undergoes a qualification process. If a structure shows anomalies or exceeds the margins of classic Elliott behavior, such as excessive retracements or unusual proportions, the engine assigns penalties to prioritize others counts that adhere to classic wave theory.

- EW Alternate Counts List Panel:  
- Appears right below the main panel, stacked vertically.   - Aligns cleanly on left edges for left corners and right edges for right corners.   - Automatically shifts the main panel upwards in bottom-corner configurations to ensure both panels fit on screen.   - Lists up to 8 counts per page with index buttons, pattern names, scores, and completion checks (`+`, `++`, etc.).   - Features mouse-wheel scrolling.   - Click-to-Select: Clicking on any alternate count row instantly updates the chart drawing to showcase that specific pattern.
Ideal For

Technical market analysts and price-action specialists who seek to assist their wave counting and automate the mapping of price expansions and contractions.

Important Note: This indicator does not take into account all Elliott Wave guidelines; for example, it does not include "The Right Look".

How to Use
  • Start the Analysis: Click the "Start" button to select the starting point of the wave count. This should be an extreme point from which the count originates.

  • Historical Range: We recommend selecting a range of 100 to 200 historical bars. Calculating the wave structure is resource-intensive; while you can experiment with a larger historical range, please be aware that processing times will increase. If you require analysis over a larger historical range, we recommend switching to higher timeframes.

  • Run the Count: Click the "Auto EW" button to execute the count within your selected range.

  • Manage Projections: You can toggle the visual projections by clicking the "Projections: ON / Projections: OFF" button.

  • Navigation: Use the "< Prev" and "Next >" buttons on the interface to view alternative wave counts.

Filters: by Score, by Range, by Guides, and by S. Sup.

  • Score: Based on the overall point rating.
  • Range: Based on the price range covered.
  • Guides: Based on guidelines.
  • S. Sup: Based exclusively on the score of the higher-degree pattern.

The Vertical label spacing multiplier has been set to 1 by default. However, if you notice that labels overlap on the same vertex, we recommend increasing this value to 2 or 3 to resolve the issue (for example, in assets like BTC).


By default, the indicator is configured to perform a count automatically as soon as it is loaded onto the chart. But It works best when the user selects the range they want the indicator to process and then clicks "Auto EW".

Strategy Tester:

The interactive panel is now supported in the Strategy Tester. It performs almost identically to real-time Live Charts (only minor differences are expected due to the nature of the testing engine).

I have included the following useful settings to use in the Strategy Tester:
  1. Auto-analyze on load = true (by default)
  2. Analyze on new bar close = true (by default)


    おすすめのプロダクト
    Pure Diamond Trend Exhaustion Pure Diamond Trend Exhaustion インジケーターは、市場の勢いの枯渇(エグゾースト)ゾーンと潜在的な価格反転ポイントを特定するように設計されています。コアアルゴリズムは価格の極値とローソク足のヒゲの構造分析に基づいており、標準的な遅行型オシレーターを使用することなく、重要な買われすぎおよび売られすぎのレベルを強調することができます。 技術的特徴: リペイントなし (No Repaint): インジケーターの信号(ダイヤモンド)は、現在のローソク足が確定した直後に固定されます。一度形成された信号は、その後の価格変動で消えたり位置が変わったりすることはありません。 ノイズフィルタリングアルゴリズム: プログラムはローソク足の実体とヒゲの比率を分析し、確立された価格範囲内の偽の変動を排除します。 汎用性: 外貨(FX)、暗号資産、株価指数、コモディティを含むすべての資産タイプに対応しています。あらゆる時間足での使用に適しています。 ミニマリストなインターフェース: 可視化は図形シンボルで実装されているため、
    ICT Institutional Zones Pro — Trade with Institutional Precision Stop wasting time manually drawing key ICT levels every day. ICT Institutional Zones Pro is a professional-grade MT5 indicator built for traders who use ICT (Inner Circle Trader) and Smart Money Concepts (SMC) to read market structure with precision. This indicator automatically maps the most important institutional levels directly on your chart, helping you instantly identify where smart money is likely accumulating, distributing
    Smart Money Structure & Precision Trading Indicator (MT5) Smart Money Structure & Precision Trading Indicator  is a powerful Smart Money Concepts (SMC) indicator for MetaTrader 5, designed to help traders identify high-probability entries with institutional logic . This indicator automatically detects market structure in real time , highlights key liquidity levels , and provides clear, non-repainting signals so you can trade with confidence and precision. Whether you are a scalper, day trader, o
    NEXY is a professional multi-timeframe trading system based on Market Structure (HH/HL/LH/LL) and Fibonacci Retracement zones.  CORE STRATEGY: The EA identifies pivot points (higher highs, higher lows, lower highs, lower lows) to determine the market structure. Once the main structure is established, it calculates Fibonacci retracement zones (0.618-0.786) where the price is likely to retrace before continuing in the direction of the trend. You can select which timeframes to align with the main
    Develop this indicator for periods of 30 minutes or more, focus on getting market trends right and making sure they are met. MFOP v8.1 gets straight to the point: it scans the market and tells you exactly when there is enough strength to enter a trade. This indicator doesn't do magic, it uses mathematical algorithms to filter out market noise, not enter into false breakouts and show you clear BUY (blue arrow) and SELL (red arrow) opportunities. It is designed and optimized specifically to take
    An all‑in‑one trading assistant that blends AI candle synthesis with a 15‑pattern Heat Map, ATR‑scaled S/R & pivots, and a Vigilant risk monitor (LOC/TF/SR/PAT gates, Ready%, EM points, SR‑distance bar). The Opportunity Advisor adds ETAs, checklists and gate status; Multi‑TF Confluence confirms alignment from M1–D1. The Professional Trade Suggestion panel shows regime, session filter, R:R presets, Partials and Quality Pause. Clean, readable UI with one‑click S/R toggles, scanners and a built‑in,
    Most traders buy oversold and sell overbought. This system does the exact opposite — on purpose. In strong trending markets, price can stay overbought or oversold for a very long time. We deliberately enter when the market is already “stretched” because that is exactly when the trend is strongest and most likely to continue. We put a tight Stop Loss (eg. 3 ATR) and hold the position till the trend ends. This is the same style of the famous Turtles traders.
    Pattern Builder Pro — MetaTrader 5 用カスタムスイングパターンスキャナー Pattern Builder Pro は、任意のカスタムスイングパターンを手描きで作成し、複数の時間足にわたって Market Watch 内のすべての銘柄から統計的に類似した値動きの形状をスキャンできる MetaTrader 5 用インジケーター兼マーケットスキャナーです。ヘッドアンドショルダー、トライアングル、フラッグなど固定形状に限定される従来のチャートパターンインジケーターとは異なり、この MT5 パターン認識ツールでは独自のプライスアクションパターンを自由に定義でき(スイングポイント数・形状ともに任意)、Dynamic Time Warping(DTW)や Procrustes 解析を含む 11 項目の重み付け類似度エンジンによりリアルタイムで一致する形状を検出します。 主な機能: XYグリッド上のインタラクティブなパターン描画ボード、ピクセル単位でのスイングポイント配置 多指標類似度エンジン:形状、角度シーケンス、傾き、リトレースメント、エクステンション、スイング比
    Ultimate Double Top & Bottom (Pro Volume Matrix) Stop trading retail breakouts. Start trading Institutional Traps. The   Ultimate Double Top & Bottom   is not a standard, lagging pattern scanner. It is a highly advanced, non-repainting structural engine equipped with a proprietary   3-Leg Volume Matrix . Designed exclusively for Smart Money Concepts (SMC) and order flow traders, this indicator mathematically dissects the tick volume inside M and W patterns to reveal true institutional intent:  
    Projection インジケーター(BCB Elevate)は、完全なプロ仕様のマーケット構造およびトレンド追従ツールです。手動トレーダー向けに作られており、マクロトレンドフィルター(EMA 100)、動的な ATR トレーリングストップ、スイングの高値/安値(Swing High/Low)ピボット追跡を組み合わせ、高精度なチャートシグナルを提供します。 チャートを再描画したり散らかしたりする代わりに、Projection インジケーターは条件が厳密に整うまで待機し、エントリー矢印、ストップロスの目標、テイクプロフィットレベルを描画します。 主な機能: トレンド検出: 構造的なスイング高値/安値を使用して真の市場トレンドを識別します。 マクロフィルター: EMA 100 を基準線として用い、支配的なモメンタムに沿った取引のみを行えるようにします。 動的 ATR ストップ: 変動性に応じたストップロスと二段階のテイクプロフィット(TP1 と TP2)ゾーンを自動計算します。 RSI ピーク検出: 取引中に RSI が極端な過熱/過冷状態に達したときにアラートを出し、理想的な決済機会を提
    Anubi Terminal is a professional trade management assistant designed for manual traders who demand precision, speed, and strict risk control. Unlike automated bots, Anubi puts the trader in control, providing a sophisticated interface to execute and manage trades according to institutional-grade risk management rules. Why Anubi Terminal? Manual trading often fails due to calculation errors and emotional exits. Anubi eliminates these risks by automating position sizing and trade management based
    Canal de Máximos y Mínimos en Escalera Indicador avanzado para MT5 diseñado para analizar el rango diario del precio y construir niveles dinámicos en forma de escalera. El indicador calcula los máximos y mínimos reales de cada día, obtiene una distancia promedio histórica y la divide según el valor configurado en INPUT_Distancia . Con esa distancia genera niveles superiores e inferiores que sólo aparecen cuando el precio los alcanza. La línea amarilla representa el centro del canal. Desde ese pu
    This indicator shows external bars ("Aussenstäbe") in the chart in candle form. The colors of the candles can be set individually. Also different colors for bearish and bullish bars are possible. In addition, the color of the wicks or outlines is also adjustable. Outside bars are mentioned e.g. by Michael Voigt in the book "Das große Buch der Markttechnik". All other candles are inner bars.
    unleash the Power of Automation: The Precision Bollinger Bands EA and  Stop Guessing. Start Executing. Let Our Algorithm Trade for You. Are you tired of staring at charts all day, battling emotions, and missing opportunities? Introducing the   Precision Bollinger Bands EA , your 24/7 automated trading partner engineered to systematically capitalize on market contractions and expansions. This isn't just another indicator; it's a complete, rule-based strategy packaged into a powerful Expert Adviso
    "Manual channel drawing? Not anymore. Let the market structure reveal itself automatically." "Track long-term price zones 24/7, in real-time." Real Trader Pain Points Identifying pivot points manually takes   huge time   and   effort Difficult to adapt to   high volatility   and pinpoint   reliable channels Copy Ideas "Markets never sleep. Why should your analysis stop?" "Dozens of assets a day—how do you keep up?" Core Claim AutoChannels   automatically reads market structure , reducin
    Send me a message so I can send you the setfile 複数の構成が可能な堅牢なロボット 以下のスクリーンショットの設定を使用して、10 分間の時間枠で BTC を使用します。 エキスパート ロボットを購入すると、ボットを継続的に改善するために変更を要求する権利があります。 主な特徴 移動平均クロスオーバー戦略: EA は 2 つの移動平均 (MA1 と MA2) を使用して取引シグナルを生成します。 より速い MA (MA1) がより遅い MA (MA2) より上または下にクロスオーバーすると、取引がトリガーされます。 マーチンゲール戦略: 取引で損失が発生した場合、次の取引のロット サイズは乗数 (martingaleMultiplier) によって増加されます。 マーチンゲール シーケンスは、トレードが成功した後、またはマーチンゲール ステップの最大数 (maxMartingale) に達したときにリセットされます。 リスク管理: ストップロス(SL)とテイクプロフィット(TP)のレベルは設定可能です。 利益を確定し
    Triplet Cloud MTF is an indicator for trend-following strategy. It presents the trend in HTF from the LTF Chart that allows traders focus on looking for trade entry in the right direction and increase striking rate. It comes with simple input setup. You will only need to choose HTF you want to follow its trend and set the alert setup, then all is set. Here are the mostly selected HTF setup for each of entry timeframe: M1 Entry   : M15 Trend M5 Entry   : H1 Trend M15 Entry   : H4 Trend H1 Entry  
    Ai Scalper Pro
    Dhiraj Shivprabhu Pattewar
    1. Precision Entry Engine (The Edge) True-Swing Breakout Technology: The EA doesn't rely on lagging indicators. It maps live market structure, identifying localized "True Swings" (fractal highs and lows) to anticipate explosive momentum breakouts. Pre-Emptive Stacking: Anticipates major moves by placing resting Stop orders exactly at critical levels. When Gold breaks out, you are already in the trade. Daily Clean-Sweep: Every day at rollover (23:50), the bot automatically purges all resting o
    Elliot Wave Pro is an MT5 indicator that automatically detects Elliott Wave structures (impulse and corrective behavior) and calculates key Fibonacci-based retracement/limit levels from the most recent completed wave. It helps turn wave structure into a tradable setup: enter on the pullback, target Wave 1 , and place your stop beyond the wave high / invalidation level . That gives you a clear risk-to-reward model where a single valid setup can outweigh multiple small losses. In short, it shows w
    E2C Lines
    Eduardo Cristian De Carvalho
    Descubra o poder do nosso indicador de alta precisão, projetado para identificar as regiões de alvo e exaustão de qualquer ativo. Testado e validado por mais de 3 anos nos mercados de mini dólar e mini índice, ele oferece confiabilidade e eficácia incomparáveis. Transforme sua estratégia de trading e alcance novos patamares de sucesso com nossa ferramenta inovadora.
    HA Supertrend ADX is a MetaTrader 5 trend Expert Advisor inspired by the TradingView Heikin Ashi Supertrend ADX concept. It combines Heikin Ashi candle alignment, Supertrend direction on HA prices, and an ADX strength filter. Features • Heikin Ashi trend confirmation • Supertrend on Heikin Ashi OHLC (TradingView-style) • ADX minimum threshold with optional DI+ / DI- filter • Supertrend flip exit and/or ATR trailing stop • Optional initial ATR stop loss • Margin cap and maximum lot limit • XAU
    PriceActionToolKit - Professional ICT & Smart Money Concepts Indicator Transform Your Trading with Institutional-Grade Analysis PriceActionToolKit is a comprehensive indicator that brings the power of Inner Circle Trader (ICT) methodology and Smart Money Concepts directly to your MetaTrader 5 platform. This all-in-one solution eliminates the guesswork from your trading decisions by automatically identifying the key market structures that institutional traders use to move the markets. Why This
    このマルチタイムフレームとマルチシンボルインジケーターは、ダブルトップ/ボトム、ヘッド&ショルダー、ペナント/トライアングル、フラグパターンを識別します。ネックライン/トライアングル/旗竿のブレイクアウトが発生した場合にのみアラートを設定することもできます(ネックラインブレイクアウト=上下および頭と肩の確認された信号)。     インジケーターはシングルチャートモードでも使用できます。このオプションの詳細については、製品の     ブログ 。独自のルールとテクニックを組み合わせることで、このインジケーターを使用して、独自の強力なシステムを作成(または強化)できます。 特徴 マーケットウォッチウィンドウに表示されているすべてのシンボルを同時に監視できます。インジケーターを1つのチャートに適用し、市場全体を即座に監視します。 M1からMNまでのすべての時間枠を監視でき、パターンが識別されたとき、またはブレイクアウト時にリアルタイムのアラートを送信します。すべてのMetatraderネイティブアラートタイプがサポートされています。 RSIをトレンドフィルターとして使用して、潜在的な反転を適
    Linear Trend Predictor ー - エントリ ポイントと方向サポート ラインを組み合わせたトレンド インジケーター。高値/安値チャネルを突破するという原理に基づいて機能します。 インジケーターのアルゴリズムは市場のノイズをフィルタリングし、ボラティリティと市場の動向を考慮します。 インジケーターの機能  平滑化手法を使用して、市場のトレンドと、買い注文または売り注文を開くためのエントリー ポイントを表示します。  任意の時間枠のチャートを分析して、短期および長期の市場の動きを判断するのに適しています。  あらゆる市場や時間枠に適応可能な入力パラメータにより、トレーダーはインジケーターを独自にカスタマイズできます。  設定されたインジケーター信号は消えず、再描画もされません。ローソク足の終値で決定されます。  いくつかの種類の通知が矢印と組み合わされています。  このインジケーターは、独立した取引システムとして使用することも、他の取引システムへの追加として使用することもできます。  あらゆるレベルの経験を持つトレーダーが使用できます。 主なパラメータ Vol
    Veltrion Smart Fibonacci   is a clean automatic Fibonacci structure overlay for MetaTrader 5. It automatically detects recent swing highs and swing lows, then draws key Fibonacci retracement levels directly on the chart. The indicator is designed to help traders visualize market structure, retracement zones, and the golden zone without manually drawing Fibonacci tools. Key Features Automatic swing high and swing low detection Clean Fibonacci retracement overlay Horizontal Fibonacci levels for a
    DoubleBB MARSI — デイトレードに最適化されたオールインワン・チャートツール 価格の現在位置 · 市場の雰囲気 · エントリーシグナル — すべてを一画面で 一行サマリー DoubleBB MARSI は、デイトレードに必要な3つの核心情報 — 日次基準ライン · RSI による相場感 · ダブルボリンジャーバンドのシグナル — を一つのチャートに統合し、トレーダーが素早く正確な判断を下せるようサポートします。 トレーダーが得られる3つの価値 DoubleBB MARSI は単なる補助指標ではなく、デイトレードの一日のサイクル全体に必要な情報を一画面に提供します。 1. 「今、価格はどこにある?」 — 日次の重要ラインを自動表示 チャート上に次の3本のラインが自動で描かれます。 · DO (Day Open · 当日始値) · PDH (Previous Day High · 前日高値) · PDL (Previous Day Low · 前日安値) 現在価格が買い優勢ゾーンにあるのか、売り優勢ゾーンにあるのかを一瞬で判断できます。 「今日の始値より上で
    /   ********** **********   ********** **********   ********** **********   ********** **********   ********** **********   / Big Sales for Easter! Price is reduced > 50 % already! Grasp the chance and Enjoy it!  /   ********** **********   ********** **********   ********** **********   ********** **********   ********** **********   / This is a powerful EA that support single order strategy, martingale strategy, multiple timeframes strategy, etc with lots of useful indicators and self defined
    Vision  by Quant Atlas Creator:  https://www.quant-atlas.com/ Vision by Quant Atlas  is a multi component reversal signal indicator designed to identify short term bullish and bearish exhaustion points across liquid markets. The model aggregates several independent technical evidence layers, including momentum behavior, mean reversion pressure, volatility based conditions, trend interaction, timing structure, and moving average related confirmation. The final output is converted into visual conv
    Slope MA with Tester
    Mohammad Taher Halimi Tabrizi
    Rule-compliant Description Category: Trend Indicator Platform: MetaTrader 5 Type: Level Indicator Timeframes: All Trader Styles: Scalping, Day Trading, Swing Trading Markets: All Description The Slope MA With Tester is a technical indicator that evaluates the slope of a moving average relative to volatility (ATR). It highlights directional bias through a color-coded slope line and plots entry arrows when slope conditions change. Main features: Slope-based Calculation – The slope of an EMA is nor
    このプロダクトを購入した人は以下も購入しています
    ARIPoint
    Temirlan Kdyrkhan
    1 (1)
    ARIPoint is a powerful trading companion designed to generate high-probability entry signals with dynamic TP/SL/DP levels based on volatility. Built-in performance tracking shows win/loss stats, PP1/PP2 hits, and success rates all updated live. Key Features: Buy/Sell signals with adaptive volatility bands Real-time TP/SL/DP levels based on ATR Built-in MA Filter with optional ATR/StdDev volatility Performance stats panel (Success, Profit/Loss, PP1/PP2) Alerts via popup, sound, push, or email Cu
    PrimeScalping is a powerful trading companion designed to generate high-probability entry signals with dynamic TP/SL/DP levels based on volatility. Built-in performance tracking shows win/loss stats, PP1/PP2 hits, and success rates — all updated live. Key Features: Buy/Sell signals with adaptive volatility bands Real-time TP/SL/DP levels based on ATR Built-in MA Filter with optional ATR/StdDev volatility Performance stats panel (Success, Profit/Loss, PP1/PP2) Alerts via popup, sound, push, or e
    ScalpPoint is a powerful trading companion designed to generate high-probability entry signals with dynamic TP/SL/DP levels based on volatility. Built-in performance tracking shows win/loss stats, PP1/PP2 hits, and success rates — all updated live. Key Features: Buy/Sell signals with adaptive volatility bands Real-time TP/SL/DP levels based on ATR Built-in MA Filter with optional ATR/StdDev volatility Performance stats panel (Success, Profit/Loss, PP1/PP2) Alerts via popup, sound, push, or emai
    SmartScalping is a powerful trading companion designed to generate high-probability entry signals with dynamic TP/SL/DP levels based on volatility. Built-in performance tracking shows win/loss stats, PP1/PP2 hits, and success rates — all updated live. Key Features: Buy/Sell signals with adaptive volatility bands Real-time TP/SL/DP levels based on ATR Built-in MA Filter with optional ATR/StdDev volatility Performance stats panel (Success, Profit/Loss, PP1/PP2) Alerts via popup, sound, push, or e
    MasterTrend Indicator for MT5 A powerful trend-following and signal-evaluation tool MasterTrend   is a custom MT5 indicator that combines Moving Averages and ATR-based risk/reward logic to generate clear buy/sell signals. It visualizes dynamic SL/TP levels, evaluates past trade outcomes, and displays win/loss statistics in a clean on-chart panel. Key features include: Buy/Sell signals based on MA crossovers ATR-based SL/TP1/TP2/TP3 levels with visual lines and labels Signal outcome tracking wit
    MasterTrend Indicator for MT5 A powerful trend-following and signal-evaluation tool MasterTrend   is a custom MT5 indicator that combines Moving Averages and ATR-based risk/reward logic to generate clear buy/sell signals. It visualizes dynamic SL/TP levels, evaluates past trade outcomes, and displays win/loss statistics in a clean on-chart panel. Key features include: Buy/Sell signals based on MA crossovers ATR-based SL/TP1/TP2/TP3 levels with visual lines and labels Signal outcome tracking wit
    MERAVITH SCANNERは、MetaTrader 5用のプロフェッショナルな金融市場インジケーターで、複数の分析ツールを一つの統合システムにまとめています。独自の出来高加重平均価格(VWAP)手法を使用してすべての計算を自動で行い、主観的な解釈を完全に排除します。 このインジケーターは、すべての資産クラス(FX、株式、指数、商品、暗号通貨)およびM1から月足までのすべての時間軸で動作します。基本原理は「価格は出来高に従う」というものです。MERAVITHは機関投資家の出来高が集中するポイントを特定し、その集中から数学的に正確な価格レベルを導き出します。予測や投機は行わず、計算のみを行います。 MERAVITH SCANNERを使用すると、28の主要FX通貨ペアをすべての時間軸でわずか2~3分でスキャンできます。また、任意の市場をスキャンすることも可能です。例えば、約100銘柄の株式を約10分でスキャンできます。 インジケーターは、消耗レベル、均衡線、偏差、統計レベル、およびターゲット予測を算出します。 チャート要素 Origin Point :すべての計算が始まる起点です。イン
    ARICoin is a powerful trading companion designed to generate high-probability entry signals with dynamic TP/SL/DP levels based on volatility. Built-in performance tracking shows win/loss stats, PP1/PP2 hits, and success rates all updated live. Key Features: Buy/Sell signals with adaptive volatility bands Real-time TP/SL/DP levels based on ATR Built-in MA Filter with optional ATR/StdDev volatility Performance stats panel (Success, Profit/Loss, PP1/PP2) Alerts via popup, sound, push, or email Cust
    Euro Escalper — Puro no Kikan Toshi Sukyarupingu Injikeeta Euro Escalper wa, subete no entori de kikan toshi reberu no seido wo motomeru toreedaa no tame ni sekkei sareta kooseinou torihiki injikeeta desu. Gousei Shisuu (Deriv), Forex, oyobi MetaTrader 5 de riyou kanou na subete no shisan de kinoushimasu. Fibonacci beisu no ryuudousei zoon, naizou SuperTrend enjin, oyobi riaru taimu no purofesshonaru dasshubooddo wo kumiawasemasu. Shuyo na Riten Sai Egaki Nashi: Shingou yajirushi wa rousoku ashi
    Классификатор силы тренда. Показания на истории не меняет. Изменяется классификация только незакрытого бара. По идее подобен полной системе ASCTrend, сигнальный модуль которой, точнее его аппроксимация в несколько "урезанном" виде, есть в свободном доступе, а также в терминале как сигнальный индикатор SilverTrend . Точной копией системы ASCTrend не является. Работает на всех инструментах и всех временных диапазонах. Индикатор использует несколько некоррелируемых между собой алгоритмов для класси
    FFx Universal Strength Meter PRO is more than a basic strength meter. Instead of limiting the calculation to price, it can be based on any of the 19 integrated strength modes + 9 timeframes. With the FFx USM, you are able to define any period for any combination of timeframes. For example, you can set the dashboard for the last 10 candles for M15-H1-H4… Full flexibility! Very easy to interpret... It gives a great idea about which currency is weak and which is strong, so you can find the best pai
    The FFx Universal MTF alerter shows on a single chart all the timeframes (M1 to Monthly) with their own status for the chosen indicator. 9 indicators mode (MACD-RSI-Stochastic-MA-ADX-Ichimoku-Candles-CCI-PSAR). Each can be applied multiple times on the same chart with different settings. Very easy to interpret. Confirm your BUY entries when most of the timeframes are showing green color. And confirm your SELL entries when most of the timeframes are showing red color. 2 Alert Options : input to s
    The FFx Watcher PRO is a dashboard displaying on a single chart the current direction of up to 15 standard indicators and up to 21 timeframes. It has 2 different modes: Watcher mode: Multi Indicators User is able to select up to 15 indicators to be displayed User is able to select up to 21 timeframes to be displayed Watcher mode: Multi Pairs User is able to select any number of pairs/symbols User is able to select up to 21 timeframes to be displayed This mode uses one of the standard indicators
    FFx Patterns Alerter gives trade suggestions with Entry, Target 1, Target 2 and StopLoss .... for any of the selected patterns (PinBar, Engulfing, InsideBar, OutsideBar) Below are the different options available: Multiple instances can be applied on the same chart to monitor different patterns Entry suggestion - pips to be added over the break for the entry 3 different options to calculate the SL - by pips, by ATR multiplier or at the pattern High/Low 3 different options to calculate the 2 TPs -
    MetaTrader 4 version available here : https://www.mql5.com/en/market/product/24881 FFx Basket Scanner is a global tool scanning all pairs and all timeframes over up to five indicators among the 16 available. You will clearly see which currencies to avoid trading and which ones to focus on. Once a currency goes into an extreme zone (e.g. 20/80%), you can trade the whole basket with great confidence. Another way to use it is to look at two currencies (weak vs strong) to find the best single pairs
    MetaTrader 4 version available here: https://www.mql5.com/en/market/product/25793 FFx Pivot SR Suite PRO is a complete suite for support and resistance levels. Support and Resistance are the most used levels in all kinds of trading. Can be used to find reversal trend, to set targets and stop, etc. The indicator is fully flexible directly from the chart 4 periods to choose for the calculation: 4Hours, Daily, Weekly and Monthly 4 formulas to choose for the calculation: Classic, Camarilla, Fibonac
    Recommended TimeFrame >= H1. 100% Non Repainted at any moment.  Use it carefully, only with Trend Direction. Trading Usage: 2 Variants: as Range System or as BreakOut System (Both Only With Trend Direction)::: (Always use StopLoss for minimise Risk); [1] as Range System: (Recommended) in UP TREND:  - BUY in Blue Line , then if price goes down by 50 points (on H1) open Second BUY.   Close in any Profit you wish: TrailingStop(45 points) or Close when Price touches upper Gold Line. in DOWN TREND
    this indicator is a Spike detector indicator, it is specially designed to trade Boom 1000, Boom 500, Crash 1000 and Crash 500 We recommend using it on Deriv Boom and Crash indices only Its setting is intuitive, familiar, easy to use it has notification functions; audible notifications and push notifications. this tool is simple to use, easy to handle This update is based on different strategies for spikes
    This indicator is based on the crossing of two Moving Average with the RSI It is intended for scalpers Specially designed for Boom and Crash syhtetic indices from Binary.com/Deriv.com It is easy to use and intuitive. We recommend its use on M1 and is equipped with three types of notification Email alert Sound notification Push notification these parameters can be activated and deactivated.
    This indicator is a scalping indicator intended solely for the Boom and Crash indices of the Deriv Limited market It supports Boom 500, Boom 1000, Crash 500 and Crash 1000 Not repaint and no bug The settings are intuitive and easy to use The product activation number is 20 The Time Frame used depends on the user If you are an aggressive scalper then just use M1 For long trades use M15 If you are conservative use M5 Please contact me for more details of its use
    MMM Gold Sniper MT5
    Gilang Wardhana Purnama Putra
    Indicator is based on   Market Maker Strategy.   NO REPAINT. MM's are traders and their objective is to make money.  This includes strategies to trade against retails traders.  The major difference between them and other traders is that they have the ability, through access to massive volumes, to move price at their will.  So to make money, they aim to buy at a lower price and then sell at a higher price. They achieve this by:  1. Inducing traders to take positions. This is achieved by using a
    Magicx
    Hasan Abdulhussein
    The indicator places a buy or sell signal when the conditions of the strategy it was designed with are met. The strategy is guaranteed, strong, and has been tested for 9 years. The indicator is for binary options and can be converted into a bot by linking it to MT2Trading, where it sends the signal to this platform. This platform automatically opens a trade on the trading platform you are using, whether it is Pocket Option, IQ Option, or any other binary options platforms. The entry is on the n
    CBT Quantum Maverick 高効率バイナリーオプション取引システム CBT Quantum Maverickは、高いパフォーマンスとシンプルさを追求するトレーダー向けに設計されたバイナリーオプション取引システムです。カスタマイズの必要がなく、最適化された状態で使用を開始できます。シグナルに従うだけで、少しの練習でマスターできます。 主な特徴: シグナルの精度: 現在のローソク足を基に次のローソク足の取引シグナルを生成し、頻繁な再描画がありません。 多様な市場対応: バイナリーオプション取引に特化し、さまざまなブローカーや資産クラスに対応しています。 対応可能: Deriv Synthetic Charts :すべてのタイムフレームで使用可能。 OTCチャート :Quotex、PocketOption、Binomo、Stockity、IQOption、Exnova、OlympTrade、Deriv、Binolla、Homebrokerなどのブローカーに対応。MT5へのインポートは最初の1週間無料、その後は有料サービス。 FX、仮想通貨、商品市場 :幅広い資産利用が可能
    Introducing to your attention an innovative expert advisor created specifically for the most juicy and volatility    currency     basket: GBPUSD, XAUUSD and EURJPY. This system is designed using the main features of this market's movement, making it an ideal choice for dynamic trading on high-trending and medium-volatile pairs.   The signals are focused on minimizing trading risks, aiming to reduce losses to a minimum. Main features ESignals is designed to show open and close arrows at the beg
    This strategy focuses on identifying and following clear market trends by filtering out noise and short-term fluctuations. Using advanced algorithms, it highlights significant upward and downward movements, enabling traders to make data-driven decisions. The indicator is designed for simplicity and precision, ideal for traders who prefer a systematic approach to trend trading. Whether you're a beginner or an experienced trader, this tool helps you stay aligned with the dominant market direction
    PRICE WILL BE INCREASED TO £4999 SOON! 5 or 15 MINUTE CHART ONLY: A state-of-the-art trading indicator, designed with advanced analytical and mathematical programming, delivers top-tier buy and sell signals. Simply enter a small buy position when a green arrow appears and a small sell position when a red arrow is shown. While signals from this indicator are infrequent, they boast exceptional accuracy when generated. Please apply your own stop-loss and take-profit levels as needed.
    مؤشر Smart Trend Candles هو أداة فعّالة في منصة MetaTrader 4، تجمع بين عناصر تحليل فني متعددة لتحديد اتجاهات السوق وقياس قوة المشترين والبائعين. يوفر هذا المؤشر متعدد الاستخدامات إشارات مرئية واضحة تُحسّن قرارات التداول الخاصة بك. الميزات الرئيسية 1. تحديد الاتجاه يستخدم شموع Heikin-Ashi المعدلة (اختياري) لتصفية ضوضاء السوق يتضمن متوسطًا متحركًا (فترة قابلة للتكوين) لتأكيد الاتجاه تنفيذ مؤشر القوة النسبية لقياس الزخم 2. قياس القوة تشير الشموع المرمزة بالألوان إلى شدة ضغط الشراء/البيع تحليل الحج
    Advanced Analysis – Total Visual Clarity The Ichimoku Dashboard features three powerful dashboards to deliver precise trading signals based on a proven methodology. The color-coded panel design allows users to instantly identify the status of each monitored financial instrument at a glance. The combined table of the "Ichimoku Dashboard" for MetaTrader 5 is a key component that integrates and synthesizes trading signals generated by the indicators, providing a clear and immediate overview to su
    Trend Frequency Market MT5 Carry out analysis and backtest even before opening your orders, check the strategy's Winrate and stay in favor of the Trend and the strength of the movement. The TFM indicator is specialized in providing you with the strength points of the movement, painting the candles GREEN or RED to report price aggression from the Players who are acting at the exact moment. Taking advantage of this detection, the indicator plots Arrow and Entry, Stop Loss and Take Profit levels
    PRICE WILL BE INCREASED TO £4999 SOON! Knight Rider FX is a precision-engineered trading indicator that delivers highly accurate, non-repainting signals without flooding your chart. It filters out noise and selectively highlights only the highest probability trade setups. On higher timeframes, it anticipates major market reversals, while on intraday charts it pinpoints mini reversals with tactical clarity. By focusing on quality over quantity, Knight Rider FX equips traders with disciplined ent
    作者のその他のプロダクト
    Elliott Wave ABC  Overview Elliott Wave ABC is an interactive indicator designed for MetaTrader 5 (MT5) that automates the detection, scoring, and visualization of Elliott Wave Zig-Zag (A-B-C) structures. It scans chart data to locate both completed and incomplete Zig-Zag patterns, offering structural analysis, Fibonacci projection targets, and a stacked dual-panel user interface. --- Key Features 1. Automated Zig-Zag Detection & Decomposition - Scans historical chart bars for Patterns dete
    FREE
    The Liquidation Zones Heatmap is a custom technical indicator designed for the MetaTrader 4 (MT4) platform. It calculates and visualizes estimated liquidation zones based on price action and internal algorithms, displaying them as a dynamic heatmap on the chart. These zones are known by several names, sometimes referred to as liquidity pools, liquidity levels, leverage levels, liquidation heatmap levels, leverage heatmap zones, or leverage heatmap levels. These zones represent potential areas of
    The Smart Liquidation Clusters  is a custom technical indicator designed for the MetaTrader 4 (MT4) platform. It calculates and visualizes   estimated liquidation zones   based on price action and internal algorithms, displaying them as a dynamic heatmap on the chart. These zones are known by several names, sometimes referred to as liquidity pools, liquidity levels, leverage levels, liquidation heatmap levels, leverage heatmap zones, or leverage heatmap levels. These zones represent   potential
    Auto Elliott Engine The Auto Elliott Engine is a tool designed for MetaTrader 4 that automates the identification, decomposition, and projection of price structures based on the Elliott Wave Theory. Powered by a pattern-recognition engine, this indicator processes price action to identify market configurations, translating data into structured scenarios. Key Features Multi-Degree Recognition: Analyzes price action across multiple fractal levels. From higher degrees, such as Supercycle or Cycle,
    SMC Framework Pro is a technical analysis indicator developed for the MetaTrader 5 platform. It integrates multiple tools commonly associated with Smart Money Concepts (SMC) into a single environment, focusing on the visualization of price action, market structure, and selected price patterns. The indicator processes historical and incoming price data to identify structural points, price imbalances, and recurring formations. Its purpose is to assist in chart analysis by organizing this informati
    SMC Pattern Detector  is a technical analysis tool based on  Smart Money Concepts (SMC) . This indicator automates the identification of market structure, supply/demand zones, and SMC patterns. Built on a  No-Repaint  architecture, all signals are confirmed on closed bars. We believe in 100% transparency. Don't just rely on screenshots; watch how the indicator reacts to real-time market conditions. Check out our recorded live streams to see the scalping setups and signals as they happen. Watch t
    Gold Liquidation Momentum is a premium, volume and momentum indicator specifically optimized for Gold (XAUUSD) , Forex, and major Indices. It analyzes price-action dynamics and tick volume to model hypothetically the momentum of different market participants and visualizes hypothetically  buyer/seller dominance in real-time. How It Works The indicator tracks market volume across 5 distinct leverage tiers (100x, 50x, 35x, 25x, and 10x). Using an advanced mathematical decay formula tailored for no
    フィルタ:
    レビューなし
    レビューに返信