Elliott Wave Engine

Elliott Wave Engine

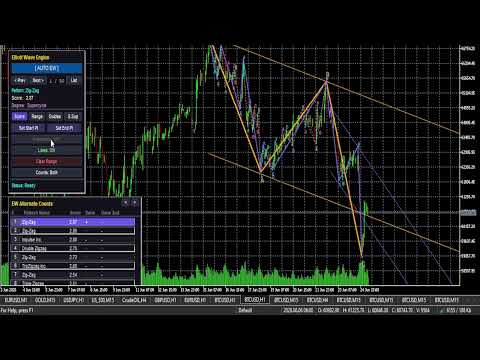
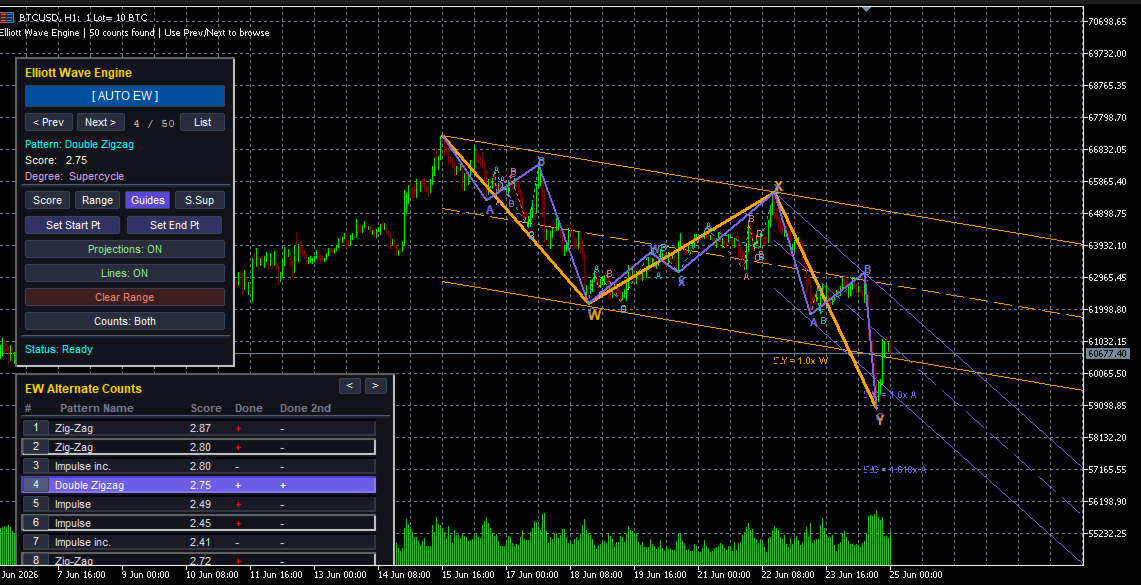
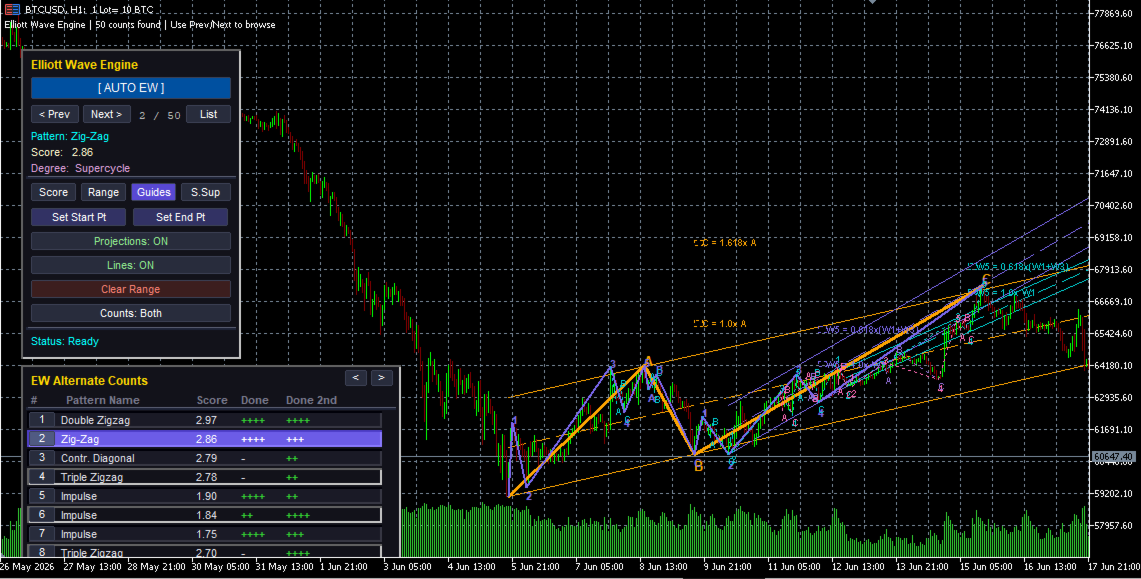
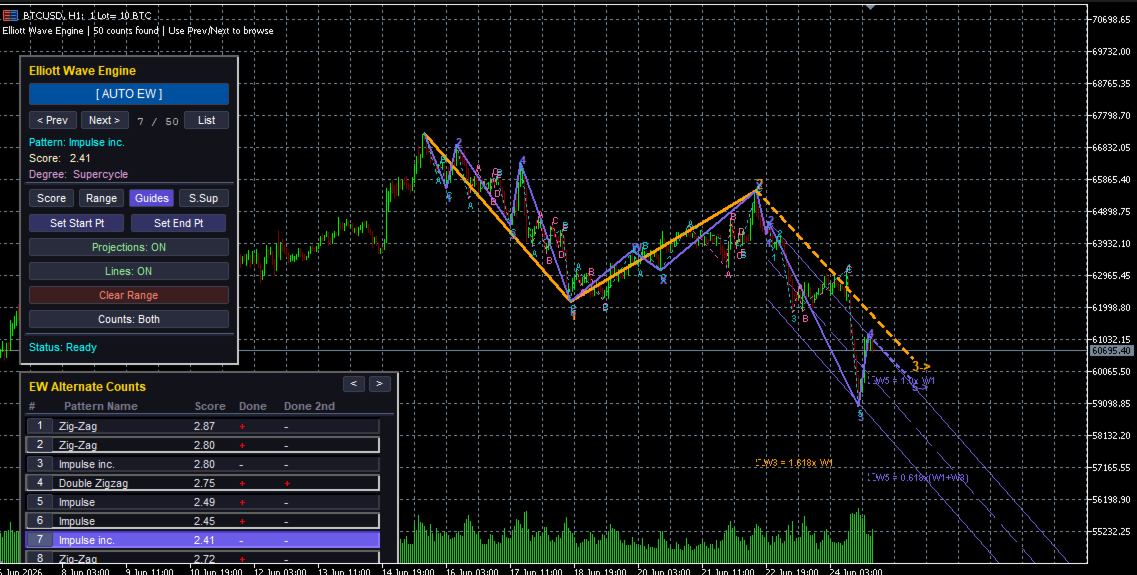
The Auto Elliott Engine is a tool designed for MetaTrader 5 that automates the identification, decomposition, and projection of price structures based on the Elliott Wave Theory.

Powered by a pattern-recognition engine, this indicator processes price action to identify market configurations, translating data into structured scenarios.

Key Features

  • Multi-Degree Recognition: Analyzes price action across multiple fractal levels. From higher degrees, such as Supercycle or Cycle, down to minor structures.

  • Pattern Decoder: Identifies impulsive formations (Standard Impulses, Contractive/Expanding Diagonals) and corrective patterns (Simple and Complex Zig-Zags, Regular/Expanded Flats, Triangles, and WXY/WXYXZ Combinations).

  • Fibonacci Projections: The system projects retracement and extension zones on the chart based on the active wave. The interface allows for toggling between visualizing key areas of the last wave or a mapping of all calculated ranges.

  • Scoring System: Each suggested count undergoes a qualification process. If a structure shows anomalies or exceeds the margins of classic Elliott behavior, such as excessive retracements or unusual proportions, the engine assigns penalties to prioritize others counts that adhere to classic wave theory.

- EW Alternate Counts List Panel:
  - Appears right below the main panel, stacked vertically.
  - Aligns cleanly on left edges for left corners and right edges for right corners.
  - Automatically shifts the main panel upwards in bottom-corner configurations to ensure both panels fit on screen.
  - Lists up to 8 counts per page with index buttons, pattern names, scores, and completion checks (`+`, `++`, etc.).
  - Features mouse-wheel scrolling.
  - Click-to-Select: Clicking on any alternate count row instantly updates the chart drawing to showcase that specific pattern.

Ideal For

Technical market analysts and price-action specialists who seek to assist their wave counting and automate the mapping of price expansions and contractions.

Important Note: This indicator does not take into account all Elliott Wave guidelines; for example, it does not include "The Right Look".

How to Use

  • Start the Analysis: Click the "Start" button to select the starting point of the wave count. This should be an extreme point from which the count originates.

  • Historical Range: We recommend selecting a range of 100 to 200 historical bars. Calculating the wave structure is resource-intensive; while you can experiment with a larger historical range, please be aware that processing times will increase. If you require analysis over a larger historical range, we recommend switching to higher timeframes.

  • Run the Count: Click the "Auto EW" button to execute the count within your selected range.

  • Manage Projections: You can toggle the visual projections by clicking the "Projections: ON / Projections: OFF" button.

  • Navigation: Use the "< Prev" and "Next >" buttons on the interface to view alternative wave counts.

Filters: by Score, by Range, by Guides, and by S. Sup.

Score: Based on the overall point rating.

Range: Based on the price range covered.

Guides: Based on guidelines.

S. Sup: Based exclusively on the score of the higher-degree pattern.

The Vertical label spacing multiplier has been set to 1 by default. However, if you notice that labels overlap on the same vertex, we recommend increasing this value to 2 or 3 to resolve the issue (for example, in assets like BTC).


By default, the indicator is configured to perform a count automatically as soon as it is loaded onto the chart. But It works best when the user selects the range they want the indicator to process and then clicks "Auto EW".

Strategy Tester:

Because the panel wasn't working in the strategy tester, I added 2 settings,
1- Auto/analyze on load = true by default
2- Analyze on new bar close = true by default
The panel is not yet working in the strategy tester due to internal programming language issues but that newer configuration will help backtest it on strategy tester. The panel is fully functional in real-time charts (Live Charts).


추천 제품
Pure Diamond Trend Exhaustion Pure Diamond Trend Exhaustion 지표는 시장의 추세 소진 구간과 잠재적 가격 반전 지점을 식별하기 위해 설계되었습니다. 핵심 알고리즘은 가격의 극점과 캔들 꼬리 구조 분석을 기반으로 하며, 기존의 지연성 보조지표를 사용하지 않고도 유의미한 과매수 및 과매도 수준을 포착합니다. 기술적 특징: 신호 재분석 없음 (No Repaint): 지표 신호(다이아몬드)는 현재 캔들이 마감되는 즉시 고정됩니다. 한 번 생성된 신호는 이후의 가격 변동에 따라 사라지거나 위치가 바뀌지 않습니다. 노이즈 필터링 알고리즘: 본 프로그램은 캔들의 몸통과 꼬리 비율을 분석하여 설정된 가격 범위 내의 거짓 파동을 필터링합니다. 범용성: 외환(Forex), 암호화폐, 지수, 원자재를 포함한 모든 자산군에 최적화되어 있으며, 모든 타임프레임에서 사용 가능합니다. 미니멀한 인터페이스: 시각화가 그래픽 심볼로 구현되어 트레이더의 작업 공간을 방
ICT Institutional Zones Pro
Celestine Anyango Wabomba
ICT Institutional Zones Pro — Trade with Institutional Precision Stop wasting time manually drawing key ICT levels every day. ICT Institutional Zones Pro is a professional-grade MT5 indicator built for traders who use ICT (Inner Circle Trader) and Smart Money Concepts (SMC) to read market structure with precision. This indicator automatically maps the most important institutional levels directly on your chart, helping you instantly identify where smart money is likely accumulating, distributing
Smart Money Structure & Precision Trading Indicator (MT5) Smart Money Structure & Precision Trading Indicator  is a powerful Smart Money Concepts (SMC) indicator for MetaTrader 5, designed to help traders identify high-probability entries with institutional logic . This indicator automatically detects market structure in real time , highlights key liquidity levels , and provides clear, non-repainting signals so you can trade with confidence and precision. Whether you are a scalper, day trader, o
NEXY is a professional multi-timeframe trading system based on Market Structure (HH/HL/LH/LL) and Fibonacci Retracement zones.  CORE STRATEGY: The EA identifies pivot points (higher highs, higher lows, lower highs, lower lows) to determine the market structure. Once the main structure is established, it calculates Fibonacci retracement zones (0.618-0.786) where the price is likely to retrace before continuing in the direction of the trend. You can select which timeframes to align with the main
MFOP Market Forecast
Oscar Josue Pin Bacuzoy
Develop this indicator for periods of 30 minutes or more, focus on getting market trends right and making sure they are met. MFOP v8.1 gets straight to the point: it scans the market and tells you exactly when there is enough strength to enter a trade. This indicator doesn't do magic, it uses mathematical algorithms to filter out market noise, not enter into false breakouts and show you clear BUY (blue arrow) and SELL (red arrow) opportunities. It is designed and optimized specifically to take
An all‑in‑one trading assistant that blends AI candle synthesis with a 15‑pattern Heat Map, ATR‑scaled S/R & pivots, and a Vigilant risk monitor (LOC/TF/SR/PAT gates, Ready%, EM points, SR‑distance bar). The Opportunity Advisor adds ETAs, checklists and gate status; Multi‑TF Confluence confirms alignment from M1–D1. The Professional Trade Suggestion panel shows regime, session filter, R:R presets, Partials and Quality Pause. Clean, readable UI with one‑click S/R toggles, scanners and a built‑in,
Most traders buy oversold and sell overbought. This system does the exact opposite — on purpose. In strong trending markets, price can stay overbought or oversold for a very long time. We deliberately enter when the market is already “stretched” because that is exactly when the trend is strongest and most likely to continue. We put a tight Stop Loss (eg. 3 ATR) and hold the position till the trend ends. This is the same style of the famous Turtles traders.
Ultimate Double Top & Bottom (Pro Volume Matrix) Stop trading retail breakouts. Start trading Institutional Traps. The   Ultimate Double Top & Bottom   is not a standard, lagging pattern scanner. It is a highly advanced, non-repainting structural engine equipped with a proprietary   3-Leg Volume Matrix . Designed exclusively for Smart Money Concepts (SMC) and order flow traders, this indicator mathematically dissects the tick volume inside M and W patterns to reveal true institutional intent:  
BCB Elevate의 Projection 지표는 완전한 프로페셔널급 마켓 구조 및 추세 추종 도구입니다. 수동 트레이더를 위해 제작되었으며, 매크로 트렌드 필터(EMA 100), 동적 ATR 트레일링 스탑, 스윙 고점/저점(Swing High/Low) 피벗 추적을 결합하여 매우 정확한 차트 신호를 제공합니다. 차트를 재그리거나 혼잡하게 만드는 대신 Projection 지표는 엄격한 조건이 맞을 때까지 기다렸다가 진입 화살표, 손절(Stop Loss) 목표 및 이익 실현(Take Profit) 레벨을 표시합니다. 주요 기능: 추세 감지: 구조적 스윙 고점/저점을 사용하여 진정한 시장 추세를 식별합니다. 매크로 필터: EMA 100을 기준선으로 사용하여 지배적인 모멘텀에 따라 거래하도록 보장합니다. 동적 ATR 스탑: 변동성에 따른 손절과 이중 테이크프로핏(TP1 & TP2) 구역을 자동으로 계산합니다. RSI 피크 감지: 거래 중 RSI가 극단적인 과매수/과매도 수준에 도달하면 알림
Anubi Terminal MT5
Marco Maria Savella
Anubi Terminal is a professional trade management assistant designed for manual traders who demand precision, speed, and strict risk control. Unlike automated bots, Anubi puts the trader in control, providing a sophisticated interface to execute and manage trades according to institutional-grade risk management rules. Why Anubi Terminal? Manual trading often fails due to calculation errors and emotional exits. Anubi eliminates these risks by automating position sizing and trade management based
Aussenstab Markttechnik
Alexander Josef Zeidler
This indicator shows external bars ("Aussenstäbe") in the chart in candle form. The colors of the candles can be set individually. Also different colors for bearish and bullish bars are possible. In addition, the color of the wicks or outlines is also adjustable. Outside bars are mentioned e.g. by Michael Voigt in the book "Das große Buch der Markttechnik". All other candles are inner bars.
unleash the Power of Automation: The Precision Bollinger Bands EA and  Stop Guessing. Start Executing. Let Our Algorithm Trade for You. Are you tired of staring at charts all day, battling emotions, and missing opportunities? Introducing the   Precision Bollinger Bands EA , your 24/7 automated trading partner engineered to systematically capitalize on market contractions and expansions. This isn't just another indicator; it's a complete, rule-based strategy packaged into a powerful Expert Adviso
"수동 채널 그리기? 더 이상은 아닙니다. 시장 구조가 자동으로 드러나게 하세요." "장기 가격대를 연중무휴 24시간 실시간으로 추적하세요." 실제 트레이더의 고충 피벗 포인트를 수동으로 식별하려면   시간과 노력이 많이 듭니다 . 적응하기 어려움   높은 변동성   및 정확한   신뢰할 수 있는 채널 아이디어 복사 "시장은 잠들지 않습니다. 왜 분석을 멈춰야 할까요?" "하루에 수십 개의 자산을 어떻게 관리하고 계신가요?" 핵심 주장 오토채널   시장 구조를 자동으로 읽어 수작업을 줄여줍니다. "기계의 정밀성과 인간의 직관으로 분석" 기술 분석 주요 기능 설명 자동 피벗 감지 지그재그 기반 실시간 분석 멀티 타임프레임 분석 강력한 신호를 위해 더 높은 시간대를 활용 채널 채점 시스템 볼륨, 각도, 길이, 중요도 등을 평가합니다. 유사성 필터링 깔끔한 UI를 위해 중복 채널 제거 동적 지그재그 감도 시장 범위 및 기간에 맞게 조정 시각적 하이라이트 중요도에
Send me a message so I can send you the setfile 다양한 구성이 가능한 견고한 로봇 아래 스크린샷의 설정에 따라 10분 기간으로 BTC를 사용하세요. 전문가 로봇을 구매할 경우, 로봇을 지속적으로 개선하기 위해 수정을 요청할 권리가 있습니다. 주요 특징 이동 평균 교차 전략: EA는 두 개의 이동 평균선(MA1과 MA2)을 사용하여 거래 신호를 생성합니다. 빠른 MA(MA1)가 느린 MA(MA2) 위 또는 아래로 교차하면 거래가 시작됩니다. 마팅게일 전략: 거래에서 손실이 발생하면 다음 거래의 로트 크기가 승수(마팅게일 승수)만큼 증가합니다. 마팅게일 시퀀스는 승리한 거래 후 또는 최대 마팅게일 단계 수(maxMartingale)에 도달하면 재설정됩니다. 위험 관리: 손절매(SL) 및 이익실현(TP) 수준은 구성 가능합니다. 수익을 확보하고 손실을 최소화하기 위해 추적 정지 및 손익분기점 기능이 포함되었습니다. 일일 이익/손
Triplet Cloud MTF is an indicator for trend-following strategy. It presents the trend in HTF from the LTF Chart that allows traders focus on looking for trade entry in the right direction and increase striking rate. It comes with simple input setup. You will only need to choose HTF you want to follow its trend and set the alert setup, then all is set. Here are the mostly selected HTF setup for each of entry timeframe: M1 Entry   : M15 Trend M5 Entry   : H1 Trend M15 Entry   : H4 Trend H1 Entry  
Ai Scalper Pro
Dhiraj Shivprabhu Pattewar
1. Precision Entry Engine (The Edge) True-Swing Breakout Technology: The EA doesn't rely on lagging indicators. It maps live market structure, identifying localized "True Swings" (fractal highs and lows) to anticipate explosive momentum breakouts. Pre-Emptive Stacking: Anticipates major moves by placing resting Stop orders exactly at critical levels. When Gold breaks out, you are already in the trade. Daily Clean-Sweep: Every day at rollover (23:50), the bot automatically purges all resting o
Elliott Wave Pro
Timothy Chuma Ifiora
Elliot Wave Pro is an MT5 indicator that automatically detects Elliott Wave structures (impulse and corrective behavior) and calculates key Fibonacci-based retracement/limit levels from the most recent completed wave. It helps turn wave structure into a tradable setup: enter on the pullback, target Wave 1 , and place your stop beyond the wave high / invalidation level . That gives you a clear risk-to-reward model where a single valid setup can outweigh multiple small losses. In short, it shows w
E2C Lines
Eduardo Cristian De Carvalho
Descubra o poder do nosso indicador de alta precisão, projetado para identificar as regiões de alvo e exaustão de qualquer ativo. Testado e validado por mais de 3 anos nos mercados de mini dólar e mini índice, ele oferece confiabilidade e eficácia incomparáveis. Transforme sua estratégia de trading e alcance novos patamares de sucesso com nossa ferramenta inovadora.
HASuperTrendADX
Steven Wong Sing Seng
HA Supertrend ADX is a MetaTrader 5 trend Expert Advisor inspired by the TradingView Heikin Ashi Supertrend ADX concept. It combines Heikin Ashi candle alignment, Supertrend direction on HA prices, and an ADX strength filter. Features • Heikin Ashi trend confirmation • Supertrend on Heikin Ashi OHLC (TradingView-style) • ADX minimum threshold with optional DI+ / DI- filter • Supertrend flip exit and/or ATR trailing stop • Optional initial ATR stop loss • Margin cap and maximum lot limit • XAU
PriceActionToolKit - Professional ICT & Smart Money Concepts Indicator Transform Your Trading with Institutional-Grade Analysis PriceActionToolKit is a comprehensive indicator that brings the power of Inner Circle Trader (ICT) methodology and Smart Money Concepts directly to your MetaTrader 5 platform. This all-in-one solution eliminates the guesswork from your trading decisions by automatically identifying the key market structures that institutional traders use to move the markets. Why This
이 다중 시간 프레임 및 다중 기호 표시기는 이중 상단/하단, 머리 및 어깨, 페넌트/삼각형 및 플래그 패턴을 식별합니다. 또한 네크라인/삼각형/깃대 이탈이 발생한 경우에만 경고를 설정하는 것도 가능합니다(넥라인 이탈 = 상단/하단 및 헤드&숄더에 대한 확인된 신호).       지표는 단일 차트 모드에서도 사용할 수 있습니다. 이 옵션에 대한 자세한 내용은 제품의       블로그   . 고유한 규칙 및 기술과 결합하여 이 표시기를 사용하면 자신만의 강력한 시스템을 생성(또는 강화)할 수 있습니다. 특징 Market Watch 창에 표시되는 모든 기호를 동시에 모니터링할 수 있습니다. 하나의 차트에만 지표를 적용하고 전체 시장을 즉시 모니터링하십시오. M1에서 MN까지 모든 시간 프레임을 모니터링할 수 있으며 패턴이 식별되거나 중단될 때 실시간 경고를 보냅니다. 모든 Metatrader 기본 경고 유형이 지원됩니다. RSI를 추세 필터로 사용하여 잠재적 반전을 적절히 식별할 수
Linear Trend Predictor - 진입 지점과 방향성 지원선을 결합한 추세 지표입니다. 고가/저가 채널을 돌파하는 원칙에 따라 작동합니다. 지표 알고리즘은 시장 노이즈를 걸러내고 변동성과 시장 역학을 고려합니다. 표시기 기능  평활화 방법을 사용하여 시장 추세와 BUY 또는 SELL 주문을 시작하기 위한 진입 시점을 보여줍니다.  모든 기간의 차트를 분석하여 단기 및 장기 시장 움직임을 파악하는 데 적합합니다.  어떠한 시장과 시간대에도 적용할 수 있으며, 입력 매개변수를 통해 거래자는 자신에게 맞게 지표를 독립적으로 사용자 지정할 수 있습니다.  설정된 지표 신호는 사라지거나 다시 그려지지 않습니다. 이는 캔들 마감 시 결정됩니다.  여러 유형의 알림이 화살표와 결합되어 있습니다.  이 지표는 독립적인 거래 시스템으로 사용할 수도 있고, 다른 거래 시스템에 추가하는 용도로도 사용할 수 있습니다.  모든 수준의 경험을 가진 거래자가 사용할 수 있습니다. 주요 매
Veltrion Smart Fibonacci   is a clean automatic Fibonacci structure overlay for MetaTrader 5. It automatically detects recent swing highs and swing lows, then draws key Fibonacci retracement levels directly on the chart. The indicator is designed to help traders visualize market structure, retracement zones, and the golden zone without manually drawing Fibonacci tools. Key Features Automatic swing high and swing low detection Clean Fibonacci retracement overlay Horizontal Fibonacci levels for a
DoubleBB MARSI — 당일 매매에 최적화된 통합 차트 도구 가격의 현재 위치 · 시장 분위기 · 진입 시그널을 한 화면에서 한 줄 요약 당일 매매(데이트레이딩)에 필요한 핵심 정보 — 일별 가격 기준선 · RSI 분위기 · 더블 볼린저 밴드 시그널 — 을 한 화면에 통합해, 트레이더가 빠르고 정확한 의사결정을 할 수 있게 도와줍니다. 트레이더가 얻는 3가지 이점 DoubleBB MARSI 는 단순한 보조지표가 아니라, 하루 매매 사이클 전체에 필요한 정보를 한 화면에 제공합니다. 1. "지금 가격이 어디에 있는가?" — 일별 핵심 레벨 자동 표시 차트에 다음 세 라인이 자동으로 그려집니다. · DO (Day Open · 오늘 시가) · PDH (Previous Day High · 전일 고가) · PDL (Previous Day Low · 전일 저가) 현재가가 매수/매도 우위 구간 어디에 있는지 즉시 판단할 수 있습니다. "오늘 시가 위에서 거래
/   ********** **********   ********** **********   ********** **********   ********** **********   ********** **********   / Big Sales for Easter! Price is reduced > 50 % already! Grasp the chance and Enjoy it!  /   ********** **********   ********** **********   ********** **********   ********** **********   ********** **********   / This is a powerful EA that support single order strategy, martingale strategy, multiple timeframes strategy, etc with lots of useful indicators and self defined
Vision  by Quant Atlas Creator:  https://www.quant-atlas.com/ Vision by Quant Atlas  is a multi component reversal signal indicator designed to identify short term bullish and bearish exhaustion points across liquid markets. The model aggregates several independent technical evidence layers, including momentum behavior, mean reversion pressure, volatility based conditions, trend interaction, timing structure, and moving average related confirmation. The final output is converted into visual conv
Slope MA with Tester
Mohammad Taher Halimi Tabrizi
Rule-compliant Description Category: Trend Indicator Platform: MetaTrader 5 Type: Level Indicator Timeframes: All Trader Styles: Scalping, Day Trading, Swing Trading Markets: All Description The Slope MA With Tester is a technical indicator that evaluates the slope of a moving average relative to volatility (ATR). It highlights directional bias through a color-coded slope line and plots entry arrows when slope conditions change. Main features: Slope-based Calculation – The slope of an EMA is nor
Probability Range Bands
Florian Nuebling
5 (1)
The indicator ‘Probability Range Bands’ gives a prediction of the amount, how much the asset is moving from its current price. The range bands give probabilities, that the candle close will not exceed this certain price level. It is also called the expected move for the current candle close.   This Indicator is based on statistical methods, probabilities and volatility. Asset price is assumed to follow a log-normal distribution. Therefore, log returns are used in this indicator to determine the
ICT Time Cycle MT5
Robby Suhendrawan
ICT Market Time Cycle MT5 – Complete Session & Time Window Discounted   Price   $50  !!     Secure your lifetime access   now   before it switches to   subscription-only ! ICT Market Time Cycle is a professional trading indicator designed to help traders follow the ICT (Inner Circle Trader) methodology with ease. It automatically displays the main market sessions (Asia, London, and New York), along with Killzones, Silver Bullet windows, and Macro times directly on your chart. With this tool, you
이 제품의 구매자들이 또한 구매함
UZFX {SSS} 스캘핑 스마트 시그널 v4.0 MT5는 급변하는 시장에서 정확한 실시간 시그널을 필요로 하는 스캘퍼, 데이 트레이더, 스윙 트레이더를 위해 설계된 리페인팅이 없는 고성능 트레이딩 지표입니다. (UZFX-LABS)에서 개발한 이 지표는 가격 움직임 분석, 추세 확인 및 스마트 필터링을 결합하여 모든 통화 쌍과 시간대에서 높은 확률의 매수 및 매도 신호, 경고 신호, 추세 지속 기회를 생성합니다. 거래에 대한 의구심을 떨쳐버리고, 명확성, 정밀성, 그리고 규율 있는 시장 실행을 원하는 트레이더를 위해 설계된 체계적인 신호 시스템을 따르기 시작하세요. 제 추천* 최적의 시간대: 15분 이상. {H1}이 제가 가장 선호하는 시간대입니다. 그리고 그 결과는 정말 놀라울 정도입니다...!! 주요 기능 업데이트 • 자동 매수 및 매도 신호 감지 • 고급 반전 인식 로직 • 잠재적인 시장 반전 전 조기 경고 신호 • 추세 지속 확인 신호 • 진입, 손절, TP1, TP2,
Transaction Speed MT5
Ivan Stefanov
5 (3)
이 지표는 시장에서 관심이 나타나는 영역 을 강조 표시한 후, 주문이 누적되는 영역 을 보여줍니다. 이는 **대규모 오더북(호가창)**처럼 작동합니다. 이것은 거대한 자금 을 위한 인디케이터입니다. 성능은 탁월하며, 시장에서 어떤 관심이 있든 반드시 포착할 수 있습니다 . (이것은 완전히 새로 작성되고 자동화된 버전 입니다 – 이제 수동 분석은 필요하지 않습니다.) **거래 속도(Transaction Speed)**는 새로운 개념의 인디케이터로, 시장에 대규모 주문이 언제, 어디에 쌓이는지를 보여주며 , 그 이점을 분석합니다. 매우 초기 단계에서 트렌드 전환 을 감지할 수 있습니다. FX 시장에서 흔히 사용하는 "거래량(volume)"은 오해입니다. 실제로는 시간당 가격 변화량 이므로, 올바른 용어는 거래 속도 입니다. 우리가 어떻게 사고하고, 행동하며, 분석하느냐 가 가장 중요합니다. 분석 패러다임의 전환 은 필수적입니다. 이 인디케이터는 외환 시장에서의 볼륨 개념을 논리적으로
Gem SIGNAL
Shengzu Zhong
5 (1)
GEM Signal Pro GEM Signal Pro는 MetaTrader 5용 추세추종형 지표로, 차트에서 더 명확한 신호, 더 구조적인 트레이드 설정, 그리고 더 실용적인 리스크 관리를 원하는 트레이더를 위해 설계되었습니다. 단순한 화살표만 표시하는 것이 아니라, GEM Signal Pro는 전체 트레이드 아이디어를 더 깔끔하고 읽기 쉬운 방식으로 보여줍니다. 조건이 확인되면 진입가, 손절가, 목표가를 차트에 표시하여 트레이더가 설정을 더 효율적으로 검토할 수 있도록 도와줍니다. 작동 방식 이 지표는 먼저 내부 로직에 따라 유효한 초기 신호를 식별합니다. 확인 조건이 충족되면, GEM Signal Pro는 차트에 전체 설정을 표시합니다. 이를 통해 트레이더는 거래 구조를 더 명확하게 보고, 수동 분석 작업을 줄일 수 있습니다. 차트에 표시되는 거래 레벨 확인된 신호에 대해, GEM Signal Pro는 다음을 표시할 수 있습니다. 진입가 손절가 목표가 1 목표가 2 목표가 3 손
ARIPoint
Temirlan Kdyrkhan
1 (1)
ARIPoint is a powerful trading companion designed to generate high-probability entry signals with dynamic TP/SL/DP levels based on volatility. Built-in performance tracking shows win/loss stats, PP1/PP2 hits, and success rates all updated live. Key Features: Buy/Sell signals with adaptive volatility bands Real-time TP/SL/DP levels based on ATR Built-in MA Filter with optional ATR/StdDev volatility Performance stats panel (Success, Profit/Loss, PP1/PP2) Alerts via popup, sound, push, or email Cu
Azimuth Pro
Ottaviano De Cicco
5 (7)
Azimuth Pro V2: Synthetic Fractal Structure and Confirmed Entries for MT5 Overview Azimuth Pro is a multi-level swing structure indicator by Merkava Labs . Four nested swing layers, swing-anchored VWAP, ABC pattern detection, three-timeframe structural filtering, and closed-bar confirmed entries — one chart, one workflow from micro-swings to macro-cycles. This is not a blind signal product. It is a structure-first workflow for traders who care about location, context, and timing. ️ Summer Sale
PrimeScalping
Temirlan Kdyrkhan
PrimeScalping is a powerful trading companion designed to generate high-probability entry signals with dynamic TP/SL/DP levels based on volatility. Built-in performance tracking shows win/loss stats, PP1/PP2 hits, and success rates — all updated live. Key Features: Buy/Sell signals with adaptive volatility bands Real-time TP/SL/DP levels based on ATR Built-in MA Filter with optional ATR/StdDev volatility Performance stats panel (Success, Profit/Loss, PP1/PP2) Alerts via popup, sound, push, or e
OmniSync Projection
Antonio-alin Teculescu
5 (1)
Chronos Fractal Engine is an innovative price projection indicator for MetaTrader 5, designed to transform your technical analysis by intelligently identifying and projecting historical price patterns. Built upon an advanced correlation algorithm and the fractal principles of the market, this powerful tool visualizes potential future price movements, giving you a unique edge in your trading decisions. What is Chronos Fractal Engine? At its core, the Chronos Fractal Engine employs a sophisticat
Meravith MT5
Ivan Stefanov
5 (1)
마켓 메이커를 위한 도구. Meravith는 다음과 같은 기능을 제공합니다: 모든 타임프레임을 분석하고 현재 유효한 추세를 표시합니다. 강세와 약세 거래량이 동일한 유동성 구간(거래량 균형 구간)을 강조 표시합니다. 서로 다른 타임프레임의 모든 유동성 레벨을 차트에 직접 표시합니다. 텍스트 기반 시장 분석을 생성하여 참고용으로 제공합니다. 현재 추세를 기반으로 목표가, 지지선 및 손절가를 계산합니다. 거래의 위험 대비 보상 비율(Risk/Reward)을 계산합니다. 계좌 잔고에 따라 포지션 크기를 산출하고 잠재 수익을 추정합니다. 시장에 중대한 변화가 발생할 경우 경고도 제공합니다. 지표의 주요 라인: 강세/약세 거래량 소진 라인 — 목표가로 사용됩니다. 시장 추세를 나타내는 라인. 시장이 강세인지 약세인지에 따라 색상이 변경되며 추세 지지선 역할을 합니다. 색상은 주로 시장 심리를 보여줍니다. 거래량 균형선(Eq). Eq(Volume Equilibrium) 라인은 시스템의 핵심입니
This indicator automatically detects internal & swing market structure, Fibonacci Retracement and Fibo Levels. Features Full internal & swing market structure labeling in real-time Fibonacci Retracement Fibonacci Levels After purchasing the indicator, the full source code is provided, and via indicator buffers it can be easily integrated into your Expert Advisors (EAs) for automated trading strategies.
ScalpPoint
Temirlan Kdyrkhan
ScalpPoint is a powerful trading companion designed to generate high-probability entry signals with dynamic TP/SL/DP levels based on volatility. Built-in performance tracking shows win/loss stats, PP1/PP2 hits, and success rates — all updated live. Key Features: Buy/Sell signals with adaptive volatility bands Real-time TP/SL/DP levels based on ATR Built-in MA Filter with optional ATR/StdDev volatility Performance stats panel (Success, Profit/Loss, PP1/PP2) Alerts via popup, sound, push, or emai
LTL Long Trend Locator
Muhammad Usman Siddique
LTL 장기 추세 탐지기 v2.0 - 전문 추세 거래 지표 LTL 장기 추세 탐지기는 강력하고 지속적인 추세를 식별하여 트레이더가 시장에 진입하고 퇴출할 최적의 시점을 찾는 데 도움을 줍니다. 추세가 시작되고 끝나는 시점에 명확한 신호를 제공하여 올바른 방향으로 적시에 거래할 수 있도록 지원합니다. 강력한 시장 추세를 발견하고 명확한 진입점, 손절매 수준, 목표수익 수준을 통해 거래를 배치할 정확한 위치를 보여줍니다. 주요 기능: 명확한 매수/매도 신호: 시장이 상승 또는 하락할 준비가 되었을 때 화살표 표시 거래 라인 표시: 차트에 모든 수준이 명확히 표시된 완전한 거래 설정을 그립니다 추세 구역: 차트를 강세(녹색) 또는 약세(분홍색) 기간으로 색상 구분 통계 표시: 각 추세가 지속된 바 수와 포인트 수 표시 정보 패널: 현재 추세 상태 및 마지막 신호 시간 표시 알림 시스템: 새로운 신호 발생 시 팝업, 이메일 또는 소리 알림 수신 신호당 한 번만 알림(성가신 반복
SmartScalping
Temirlan Kdyrkhan
SmartScalping is a powerful trading companion designed to generate high-probability entry signals with dynamic TP/SL/DP levels based on volatility. Built-in performance tracking shows win/loss stats, PP1/PP2 hits, and success rates — all updated live. Key Features: Buy/Sell signals with adaptive volatility bands Real-time TP/SL/DP levels based on ATR Built-in MA Filter with optional ATR/StdDev volatility Performance stats panel (Success, Profit/Loss, PP1/PP2) Alerts via popup, sound, push, or e
TrendProMaster
Temirlan Kdyrkhan
MasterTrend Indicator for MT5 A powerful trend-following and signal-evaluation tool MasterTrend   is a custom MT5 indicator that combines Moving Averages and ATR-based risk/reward logic to generate clear buy/sell signals. It visualizes dynamic SL/TP levels, evaluates past trade outcomes, and displays win/loss statistics in a clean on-chart panel. Key features include: Buy/Sell signals based on MA crossovers ATR-based SL/TP1/TP2/TP3 levels with visual lines and labels Signal outcome tracking wit
Meravith Scanner
Ivan Stefanov
5 (2)
MERAVITH SCANNER는 MetaTrader 5용 전문 금융 시장 지표로, 여러 분석 도구를 하나의 통합 시스템으로 결합합니다. 독점적인 거래량 가중 평균 가격(VWAP) 방법론을 사용하여 모든 계산을 자동으로 수행하며, 주관적인 해석을 완전히 배제합니다. 이 지표는 모든 자산 클래스(Forex, 주식, 지수, 상품, 암호화폐)와 M1부터 월간 차트까지 모든 시간 프레임에서 작동합니다. 기본 원리는 “가격은 거래량을 따른다”입니다. MERAVITH는 기관 거래량이 집중되는 위치를 식별하고, 그 집중에서 수학적으로 정확한 가격 수준을 도출합니다. 예측이나 투기를 하지 않으며, 계산만 수행합니다. MERAVITH SCANNER를 사용하면 28개의 주요 Forex 통화쌍을 모든 시간 프레임에서 단 2~3분 만에 스캔할 수 있습니다. 또한 원하는 시장을 스캔할 수도 있으며, 예를 들어 약 100개의 주식을 약 10분 안에 스캔할 수 있습니다. 지표는 소진 레벨, 균형선, 편차, 통계
MasterTrend
Temirlan Kdyrkhan
MasterTrend Indicator for MT5 A powerful trend-following and signal-evaluation tool MasterTrend   is a custom MT5 indicator that combines Moving Averages and ATR-based risk/reward logic to generate clear buy/sell signals. It visualizes dynamic SL/TP levels, evaluates past trade outcomes, and displays win/loss statistics in a clean on-chart panel. Key features include: Buy/Sell signals based on MA crossovers ATR-based SL/TP1/TP2/TP3 levels with visual lines and labels Signal outcome tracking wit
VTrende Pro
Andrii Diachenko
5 (1)
VTrende Pro - MTF indicator for trend trading with a display panel for MT5 *** Videos can be translated into any language using subtitles (video language - Russian) Although the signals of the VTrende Pro indicator can be used as signals of a full-fledged trading system, it is recommended to use them in conjunction with the Bill Williams TS. VTrende Pro is an extended version of the VTrende indicator. Difference between Pro version and VTrende: - Time zones - Signal V - signal 1-2 waves -    S
ZIVA Signal Intelligence
Hassan Abdullah Hassan Al Balushi
ZIVA Signal Intelligence An Adaptive, Modular Market Intelligence System ZIVA Signal Intelligence is not positioned as a conventional trading indicator. It is a fully integrated, proprietary market intelligence system engineered to deliver structured, high-precision interpretation of price behavior within a controlled analytical environment. Developed through an independent architectural approach, ZIVA does not rely on, derive from, or replicate existing indicators. It represents a standalone
MetaTrader 5용 스마트 다층 브레이크아웃 및 풀백 탐지기 "스마트하고, 간단하고, 빠르게!" 고확률 브레이크아웃 진입을 놓치는 것에 지치셨나요? 여러 차트를 몇 시간씩 스캔하면서 브레이크아웃을 추세 방향과 통화 모멘텀에 맞추려고 하지만 — 결국 움직임을 놓치고 마나요? Break Pullback은 하나의 지표로 이 모든 문제를 해결합니다. Break Pullback이란 무엇인가요? Break Pullback은 시장 구조, 브레이크아웃, 추세 지속 설정을 거래하는 트레이더를 위해 특별히 설계된 전문가급 MetaTrader 5 지표입니다. 실시간으로 여러 통화 쌍에 걸쳐 Break와 Pullback 형성을 자동으로 감지하고 — 세 가지 확인 레이어를 통해 모든 신호를 필터링합니다: 구조적 브레이크아웃 탐지 — 차트의 주요 브레이크 레벨 식별 HTF 일봉 바이어스 — 진입을 지배적인 일봉 추세 방향에 맞춤 통화 강도 지수 — 쌍을 이룬 통화 간의 모멘텀 불균형 확인 결과: 오
Chimera Volume
Marko Milenkovic
MetaTrader 5용 Chimera Volume 고급 거래량 분석 및 시장 활동 시각화 Chimera Volume은 MetaTrader 5 전용 사용자 정의 지표로, 정규화된 거래량 활동을 분석하고 역동적인 시각적 프레임워크를 통해 시장 참여도의 변화를 보여주도록 설계되었습니다. 이 지표는 적응형 정규화 알고리즘을 사용하여 틱 거래량 데이터를 처리하며, 다양한 시장 상황 속에서 거래량의 강도, 매집 단계, 활동 변화를 구조화된 형태로 생성합니다. 원시 거래량 값을 표시하는 일반 거래량 지표와 달리, Chimera Volume은 추가 계산을 적용하여 시장 활동의 상대적 변화를 강조하고 차트의 가독성을 향상시킵니다. 주요 기능 루트 인텐트 히스토그램 (Root Intent Histogram): 정규화된 거래량 강도와 시장 참여도를 시각화하는 동적 히스토그램입니다. 적응형 색상 전환을 사용하여 활동 증가 시기와 참여 감소 시기를 명확하게 구분합니다. 관성 라인 (Inertia Line
ARICoins
Temirlan Kdyrkhan
ARICoin is a powerful trading companion designed to generate high-probability entry signals with dynamic TP/SL/DP levels based on volatility. Built-in performance tracking shows win/loss stats, PP1/PP2 hits, and success rates all updated live. Key Features: Buy/Sell signals with adaptive volatility bands Real-time TP/SL/DP levels based on ATR Built-in MA Filter with optional ATR/StdDev volatility Performance stats panel (Success, Profit/Loss, PP1/PP2) Alerts via popup, sound, push, or email Cust
" Dynamic Scalper System MT5 " 지표는 추세 파동 내에서 스캘핑 방식으로 거래하도록 설계되었습니다. 주요 통화쌍 및 금에서 테스트되었으며, 다른 거래 상품과의 호환성이 가능합니다. 추가적인 가격 변동 지원을 통해 추세에 따라 단기 포지션 진입 신호를 제공합니다. 지표의 원리 큰 화살표는 추세 방향을 결정합니다. 작은 화살표 형태의 스캘핑 신호를 생성하는 알고리즘은 추세 파동 내에서 작동합니다. 빨간색 화살표는 상승 방향을, 파란색 화살표는 하락 방향을 나타냅니다. 민감한 가격 변동선은 추세 방향으로 그려지며, 작은 화살표의 신호와 함께 작용합니다. 신호는 다음과 같이 작동합니다. 적절한 시점에 선이 나타나면 진입 신호가 형성되고, 선이 있는 동안 미결제 포지션을 유지하며, 완료되면 거래를 종료합니다. 권장되는 작업 시간대는 M1~H4입니다. 화살표는 현재 캔들에 형성되며, 다음 캔들이 이미 시작되었더라도 이전 캔들의 화살표는 다시 그려지지 않습니다. 입
First time on MetaTrader, introducing IQ Star Lines - an original Vedic Astrology based indicator. "Millionaires don't use astrology, billionaires do" . - J.P. Morgan, Legendary American financier and banker. Welcome to  the new and updated  IQ Star Lines , the ultimate fusion of ancient planetary harmonic cycles and modern quantitative trading. published for the   first time on Metatrader. This is an indicator built by the developer, who has spent almost 2 decades trading while studying Vedic
Scalping Winning Signals Pro SWS
Muhammad Usman Siddique
5 (1)
UZFX SWS {스캘핑 승리 신호} 프로 v1.0은 빠르게 움직이는 시장에서 정확한 진입 신호를 찾는 스캘퍼, 데이 트레이더, 스윙 트레이더를 위해 Usman Zabir(UZFX LABS)가 특별히 개발한 강력하고 재도색되지 않는 지표입니다. 지연이나 잘못된 재도색 없이 신뢰할 수 있는 실시간 신호를 요구하는 트레이더에게 이상적입니다. 추천* 최적 시간대: 30분 이상. {1시간}이 가장 선호하며, 결과는 놀라울 정도입니다...! 참고: { LTL 164343 } 지표와 함께 사용하면 신호 적중률을 높일 수 있습니다. LTL 신호를 통해 추세를 파악하고, SWS 신호를 진입 신호로 활용하세요. 이 접근 방식은 승률을 극대화하고 오신호를 방지하는 데 도움이 됩니다. 주요 기능: 최근 및 과거 신호를 명확한 시각적 화살표로 표시(오래된 신호는 점으로 표시 옵션 포함). 자동 계산 및 그리기 기능: 진입선, 손절선(최근 스윙 저점/고점 기준), 다중 이익실현선(RRR 1:1, 2:1
==================================================================== SMC Pro v6.1 APEX AI — XAUUSD Gold Empire MetaTrader 5 지표 · Smart Money Concepts · 예측 인텔리전스 엔진 ==================================================================== SMC Pro v6.1 APEX AI는 MetaTrader 5의 XAUUSD(골드) 전용으로 제작된 전문 Smart Money Concepts 지표 시스템입니다. 완전한 SMC 프레임워크 — Order Blocks, Liquidity sweeps(유동성 스윕), Fair Value Gaps, Break of Structure, Change of Character — 에 AI 기반의 8개 신규 모듈을 결합하여, 정밀한 시각적 신호, 예측 궤적선, 색상으로 구분된 SL/T
How to use Pair Trading Station Pair Trading Station is recommended for H1 time frame and you can use it for any currency pairs. To generate buy and sell signal, follow few steps below to apply Pair Trading Station to your MetaTrader terminal. When you load Pair Trading Station on your chart, Pair Trading station will assess available historical data in your MetaTrader platforms for each currency pair. On your chart, the amount of historical data available will be displayed for each currency pai
Euro Escalper
Cristofher Robles
5 (2)
Euro Escalper — Peulopesyeoneol Gigugeup Seukael-ping Jipyo Euro Escalper  eun mobeun jingib-eseo gigugeub jeongmilseong-eul yoguhaneun teuleideoui goseongneung georae jipyo. Hapseong Jisu (Deriv), Forex mich MetaTrader 5 eseo sayong ganeunghan modeun jasan-e jeogyong. Fibonacci giban yudongseong jiyeog, naejang SuperTrend enjin mich silsigan jeonmun daesiboeleu-leul gyeolhap. Juyo Jangjeom Jaegeurim Eobseum: Signal hwasalpyo-neun bong maegam si-eman natanago jeoldae umjigiji ankeo sarajiji anhs
이 위치가 매수에 적합한지 판단하는 데 도움을 줍니다. 이 위치가 매도에 적합한지 판단하는 데 도움을 줍니다. 네 개의 지표가 동시에 바닥에 도달하면 반등 기회를 중점적으로 살펴보시기 바랍니다. 네 개의 지표가 동시에 상단에 위치하면 하락 기회를 중점적으로 살펴보시기 바랍니다. 이 시스템은 중국의 첨단 알고리즘 기술과 고급 수학 모델링 체계를 기반으로 구축되었습니다. 저는 주로 XAUUSD M5 주기에서 이 지표를 사용하며, 이 주기가 가장 좋은 결과를 보여줍니다. 이 지표의 알고리즘과 수학 공식은 매우 복잡하기 때문에 테스트 시 진행 속도가 느릴 수 있습니다. 테스트할 때는 지표가 리페인트되는지, 지연되는지만 확인하시면 됩니다. 정식 버전은 실제 사용 시 더 안정적입니다. 이 지표 시스템은 절대 리페인트하지 않으며 미래 데이터를 사용하지 않습니다. 구매 전에 직접 테스트하고 확인하실 수 있습니다. 이 지표에는 완전히 개인화된 알림 시스템이 포함되어 있으며, 아래 링크를 통해 확인하
Premium level Pro
Dmitriy Kashevich
Premium level is a unique indicator with more than 80% accuracy of correct predictions! This indicator has been tested for more than two months by the best Trading Specialists! The author's indicator you will not find anywhere else! From the screenshots you can see for yourself the accuracy of this tool! 1 is great for trading binary options with an expiration time of 1 candle. 2 works on all currency pairs, stocks, commodities, cryptocurrencies Instructions: As soon as the red arrow app
Triple Crox Strategy
issam rahhal sabour
Triple Crox Strategy v4.10 Triple Crox Strategy v4.10 Professional MetaTrader 5 Indicator 13 Patterns • Fibonacci • CLUSTER ML • Multi-Filter 1. Overview Advanced MT5 indicator combining 13 Pattern Detection , Fibonacci Analysis , CLUSTER Machine Learning and Multi-Filter system for precise signals on Forex, indices, commodities, crypto. 5-step pipeline: indicators → filter → patterns → signals → levels. 2. Trading Setup Heikin-Ashi colored bars. Buy/Sell arrows with Entry, TP1(1x ATR), TP2(2x
Gold Xausd Hunter
Metin Erkamoglu
5 (1)
MATADOR GOLD XAUUSD M5 Scalp Signals for MT5 MATADOR GOLD is a decision-support indicator for MetaTrader 5, designed for traders who analyze short-term Gold movement on the M5 timeframe. The indicator does not open, close, or manage trades automatically. It provides buy and sell signal guidance so the user can make their own trading decisions according to their risk plan, broker conditions, and trade management rules. Main purpose MATADOR GOLD is built to help traders avoid noisy signal flow and
제작자의 제품 더 보기
Elliott Wave ABC
Enrique Gauto Sand
Elliott Wave ABC  Overview Elliott Wave ABC is an interactive indicator designed for MetaTrader 5 (MT5) that automates the detection, scoring, and visualization of Elliott Wave Zig-Zag (A-B-C) structures. It scans chart data to locate both completed and incomplete Zig-Zag patterns, offering structural analysis, Fibonacci projection targets, and a stacked dual-panel user interface. --- Key Features 1. Automated Zig-Zag Detection & Decomposition - Scans historical chart bars for Patterns dete
FREE
The Liquidation Zones Heatmap is a custom technical indicator designed for the MetaTrader 4 (MT4) platform. It calculates and visualizes estimated liquidation zones based on price action and internal algorithms, displaying them as a dynamic heatmap on the chart. These zones are known by several names, sometimes referred to as liquidity pools, liquidity levels, leverage levels, liquidation heatmap levels, leverage heatmap zones, or leverage heatmap levels. These zones represent potential areas of
The Smart Liquidation Clusters  is a custom technical indicator designed for the MetaTrader 4 (MT4) platform. It calculates and visualizes   estimated liquidation zones   based on price action and internal algorithms, displaying them as a dynamic heatmap on the chart. These zones are known by several names, sometimes referred to as liquidity pools, liquidity levels, leverage levels, liquidation heatmap levels, leverage heatmap zones, or leverage heatmap levels. These zones represent   potential
Auto Elliott Engine
Enrique Gauto Sand
Auto Elliott Engine The Auto Elliott Engine is a tool designed for MetaTrader 4 that automates the identification, decomposition, and projection of price structures based on the Elliott Wave Theory. Powered by a pattern-recognition engine, this indicator processes price action to identify market configurations, translating data into structured scenarios. Key Features Multi-Degree Recognition: Analyzes price action across multiple fractal levels. From higher degrees, such as Supercycle or Cycle,
The   Smart Liquidation Clusters    is a custom technical indicator designed for the MetaTrader 5 (MT5) platform. It calculates and visualizes   estimated liquidation zones   based on price action and internal algorithms, displaying them as a dynamic heatmap on the chart. These zones are known by several names, sometimes referred to as liquidity pools, liquidity levels, leverage levels, liquidation heatmap levels, leverage heatmap zones, or leverage heatmap levels. These zones represent   potent
SMC Framework Pro
Enrique Gauto Sand
SMC Framework Pro is a technical analysis indicator developed for the MetaTrader 5 platform. It integrates multiple tools commonly associated with Smart Money Concepts (SMC) into a single environment, focusing on the visualization of price action, market structure, and selected price patterns. The indicator processes historical and incoming price data to identify structural points, price imbalances, and recurring formations. Its purpose is to assist in chart analysis by organizing this informati
SMC Pattern Detector
Enrique Gauto Sand
SMC Pattern Detector  is a technical analysis tool based on  Smart Money Concepts (SMC) . This indicator automates the identification of market structure, supply/demand zones, and SMC patterns. Built on a  No-Repaint  architecture, all signals are confirmed on closed bars. We believe in 100% transparency. Don't just rely on screenshots; watch how the indicator reacts to real-time market conditions. Check out our recorded live streams to see the scalping setups and signals as they happen. Watch t
필터:
리뷰 없음
리뷰 답변