Fusion Harmonic Intelligence
- Experts
-
Juan Antonio Alvarenga Galindo
 Creator, designer, and developer of trading platform bots, specializing in algorithmic trading, with expertise in data science, machine learning, and statistics. Five years of trading experience, creating my own trading bots on various platforms such as MetaTrader and TradingView.
 - Version: 3.9
- Activations: 5
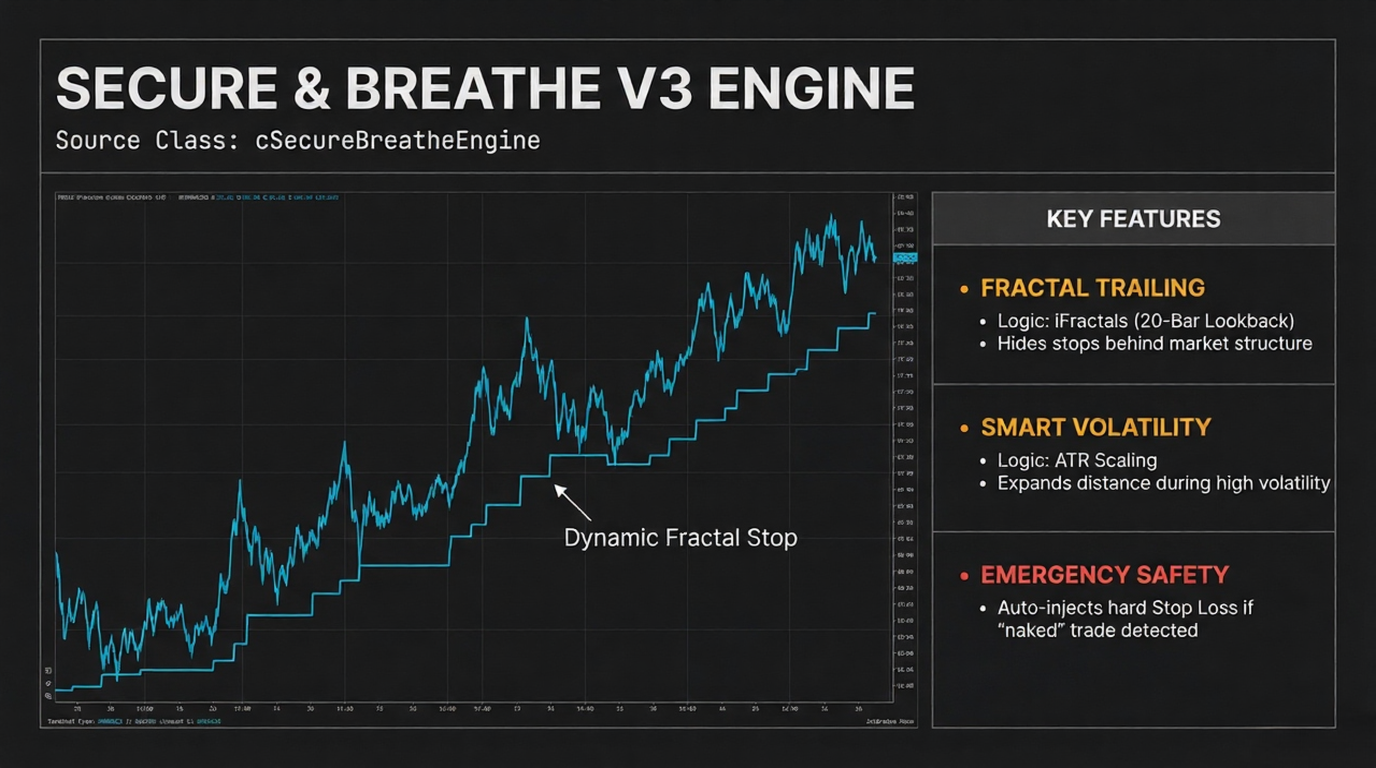
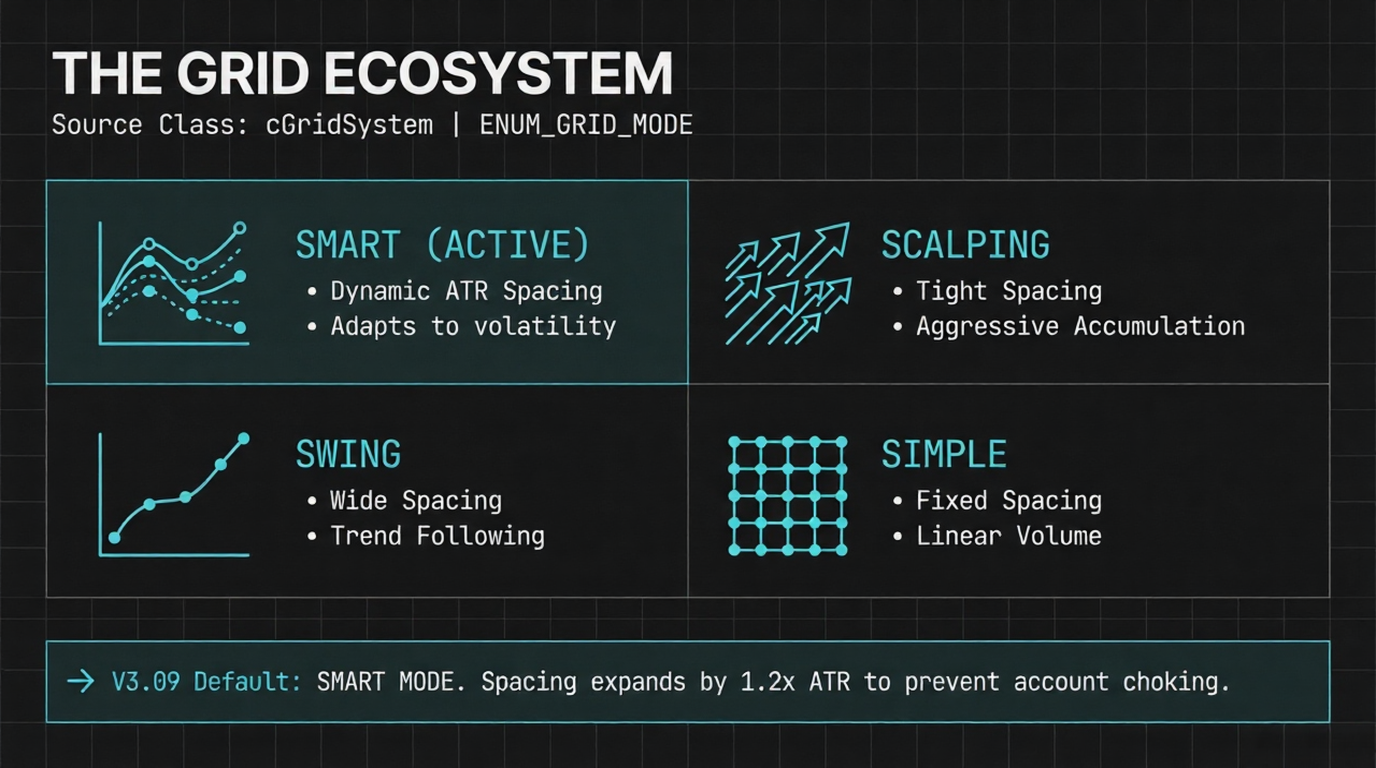
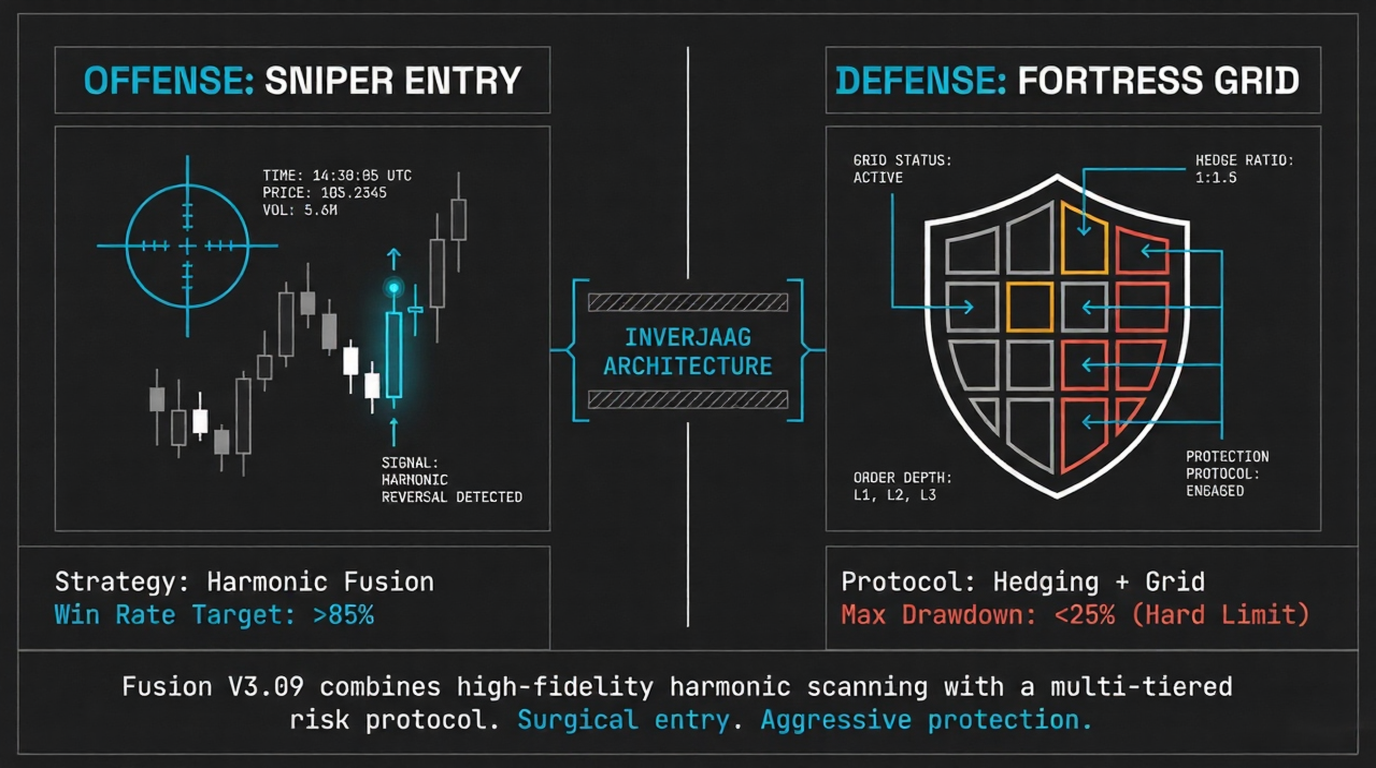
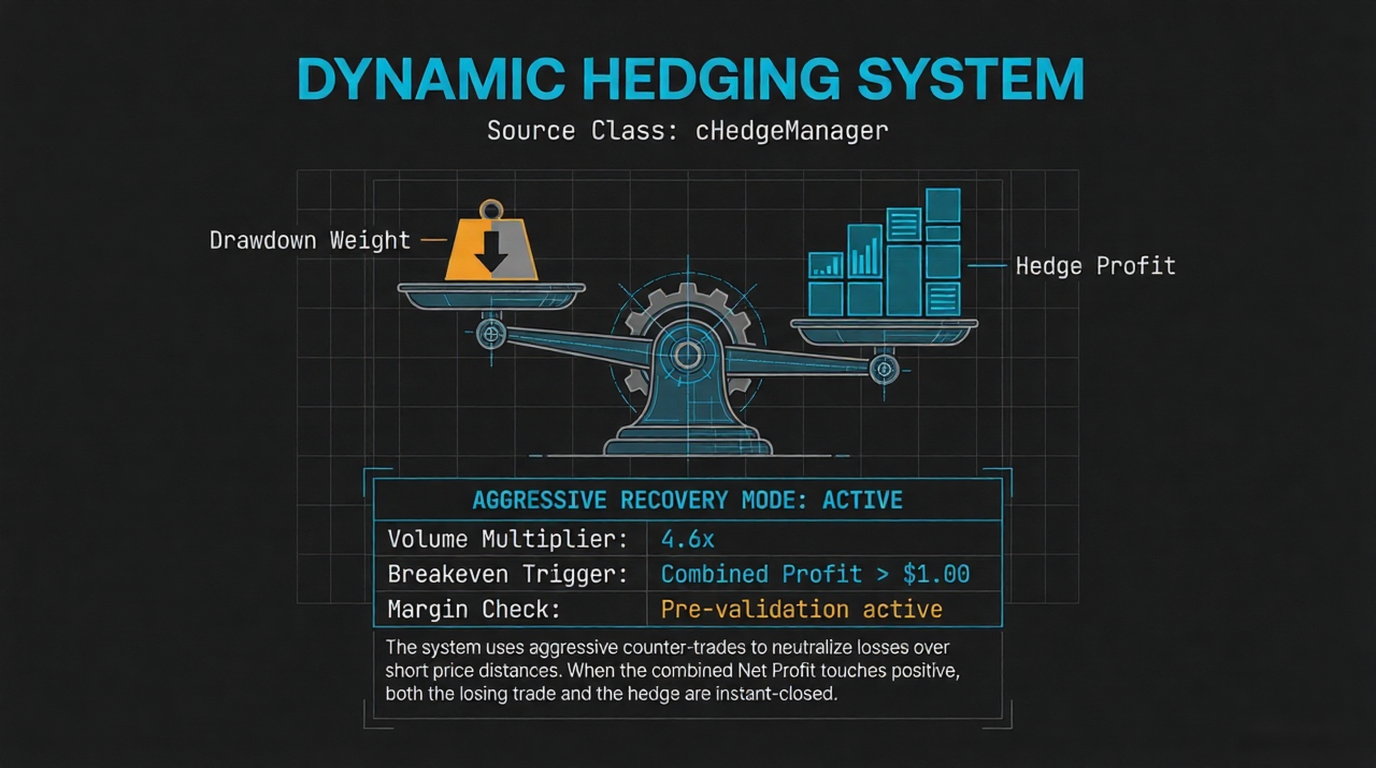
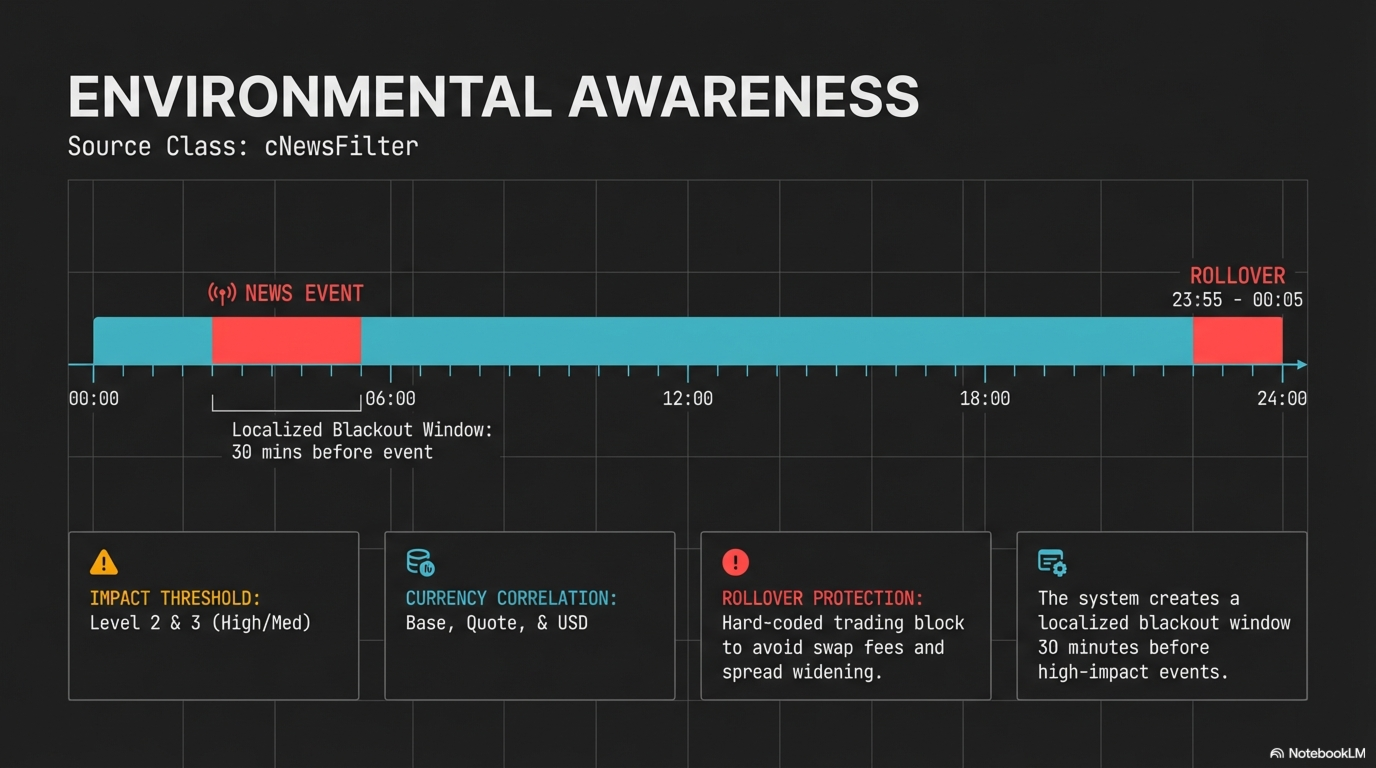
Fusion Harmonic Intelligence, designed to operate on the MetaTrader 5 platform. This tool combines harmonic pattern analysis with traditional technical indicators, such as RSI and moving averages, to identify precise market entry points. The software stands out for its robust risk management, which includes contingency plans for significant losses, an integrated news filter, and an aggressive hedging system to protect capital. Additionally, it offers operational flexibility through a dynamic trailing stop engine and the possibility of activating a smart grid strategy. The main objective of the program is to maximize profitability while keeping the drawdown controlled under strict security parameters.
Harmonic Pattern Detection Systems in Trading
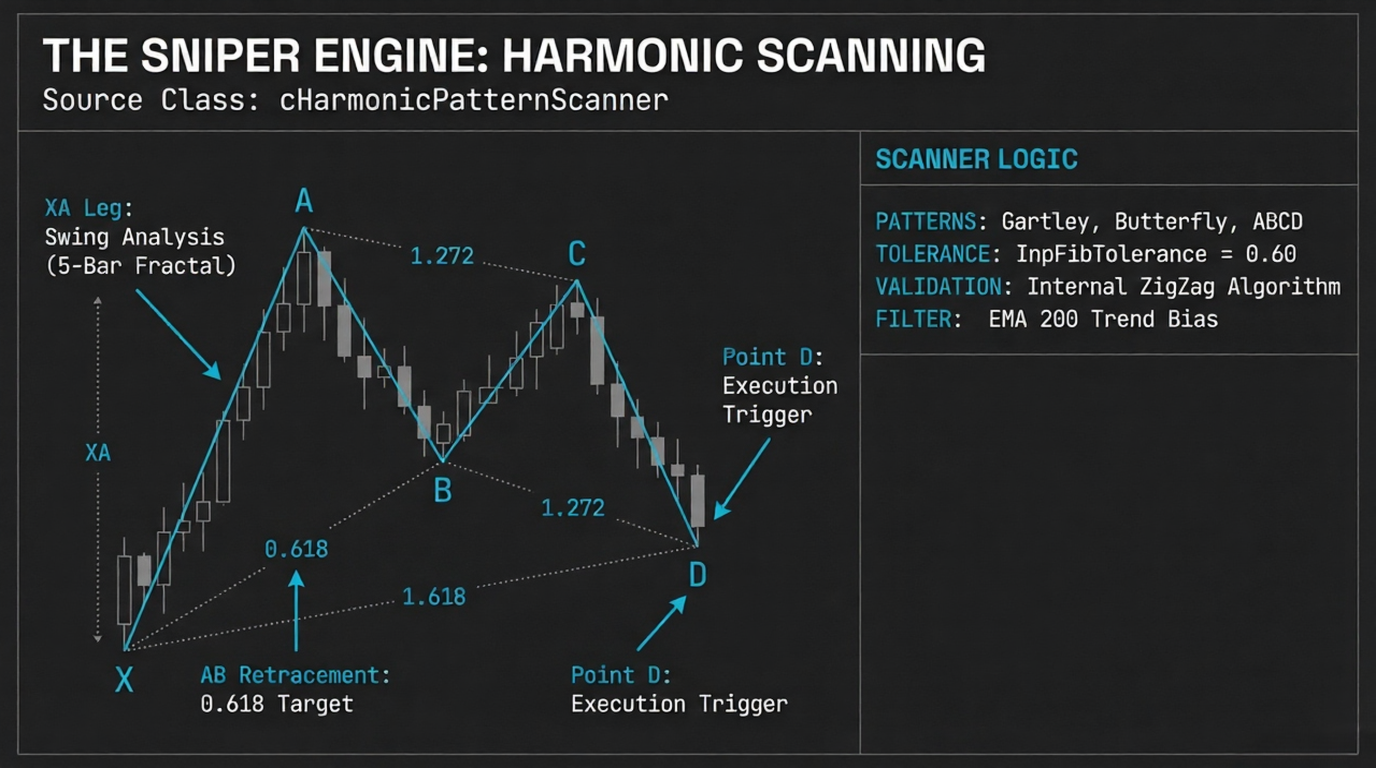
The system is programmed to detect three specific types of harmonic patterns:
1. Gartley Pattern: Detected through the evaluation of the XABCD structure. The system verifies that point B has a retracement of approximately 0.618 relative to XA, and that point D has a retracement close to 0.786.
2. Butterfly Pattern: Also uses the XABCD structure, verifying that point B retraces around 0.786 of XA and point D is an extension (1.27 or 1.618).
3. ABCD Pattern: Identified by checking that the distance of the AB segment is equal to that of the CD segment, with a retracement of C falling within a valid range between 0.5 and 0.886.
To achieve this detection, the cHarmonicPatternScanner class scans market movements to first identify 5 key swing points (X, A, B, C, and D). Additionally, the system allows the user to configure a Fibonacci tolerance (InpFibTolerance) to determine how exact the geometric proportion must be for the pattern to be considered valid.
Managing Fibonacci Tolerances in Algorithmic Analysis
Fibonacci tolerance (InpFibTolerance or m_FibTolerance) works as an allowed margin of error when evaluating exact geometric proportions between market swing points.
Since in the real market it is very rare for price movements to mathematically match Fibonacci levels perfectly, the system uses this value to determine how close a retracement or extension must be to validate a pattern.
The mechanism works as follows:
1. Difference Calculation: The system calculates the actual proportion between price movements (for example, the retracement of point B relative to the XA segment) and subtracts the exact Fibonacci value required by theory for that specific pattern.
2. Validity Evaluation: If the absolute value of that difference is greater than the configured Fibonacci tolerance, the system rejects the pattern and returns a false result.
Application in specific patterns:
• Gartley Pattern: Checks that the difference between the actual retracement of point B and the ideal level of 0.618 does not exceed the tolerance. It does the same for point D against the ideal level of 0.786.
• Butterfly Pattern: Verifies that the retracement of point B does not exceed the tolerance relative to the ideal level of 0.786, and that the extension of point D remains within the tolerance relative to the 1.27 or 1.618 levels.
• ABCD Pattern: When evaluating if the distance of the AB segment is equal to that of the CD segment (where the ideal proportion is 1.0), the system applies a slightly wider tolerance by adding 0.1 to the base tolerance (m_FibTolerance + 0.1), allowing for a bit more flexibility.
This parameter can be manually configured by the user in the system settings (InpFibTolerance), allowing them to decide whether to have stricter detection (low values) that finds fewer but more accurate patterns, or more flexible detection (high values).
Trend Synchronization in Harmonic Patterns with EMA 200
Trend filtering in harmonic pattern detection acts as an additional confirmation layer to ensure that trades suggested by patterns are in favor of the market's primary trend.
The mechanism works as follows:
1. Base Indicator: The system uses a 200-period Exponential Moving Average (EMA) (calculated on the closing price) to define the market's macro trend.
2. Activation: This function is optional and the user can activate or deactivate it through the InpFilterByTrend input parameter.
3. Filtering Rules: Once the scanner identifies a valid harmonic pattern (whether Gartley, Butterfly, or ABCD) and generates a trade signal at point "D", the system compares the price at that point D with the current value of the 200-period EMA:
◦ For Buy signals: If the pattern suggests a buy but the price at point D is below the EMA 200, the signal is rejected and ignored. This assumes that trading upward is risky because the overall trend is bearish.
◦ For Sell signals: If the pattern suggests a sell but the price at point D is above the EMA 200, the system ignores the signal. This avoids trading downward in a market with a macro bullish trend.
In summary, this filter blocks any pattern that goes against the trend established by the 200-period EMA, trading buys only when the price is above the moving average and sells only when it is below it.
Validation Protocol and Reversal Signal Strength Calculation
The system determines signal strength (SignalStrength) by assigning predefined values on a scale of 0 to 100 depending on the condition that generated the investment opportunity. Then, it uses a validation parameter called Minimum Signal Strength (MinSignalStrength), user-configurable with a default value of 80.0, to decide if the signal is good enough to be executed.
The strength calculation works as follows:
1. Base assignment according to the source strategy:
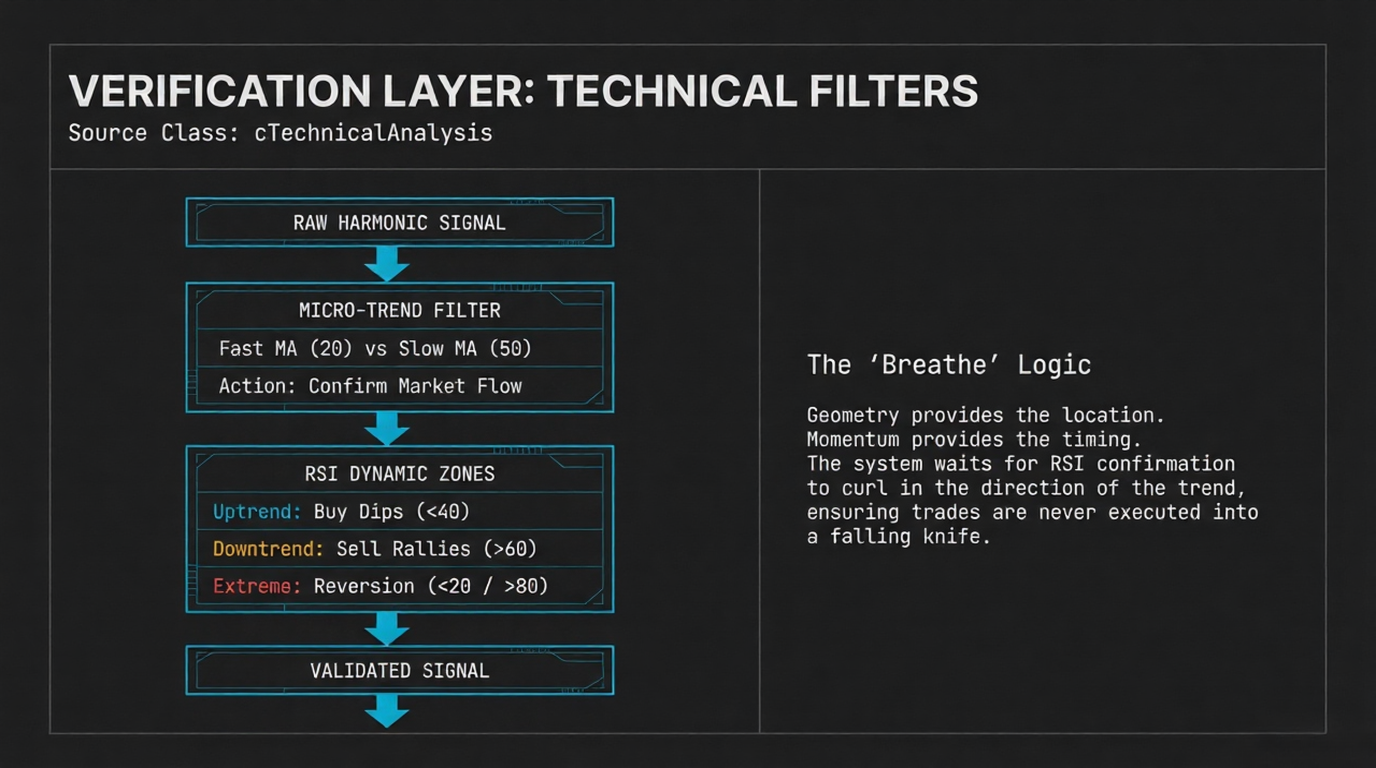
• By Technical Analysis (RSI and Moving Averages):
◦ If the system detects an opportunity based on micro-trend (e.g., buying on a small "dip" within an uptrend), it assigns a strength of 85.0.
◦ If the signal arises from an extreme mean reversion (e.g., RSI below 20 indicating extreme oversold or above 80 indicating overbought), it receives a higher strength of 90.0.
• By Harmonic Pattern Scanner:
◦ If the system detects a valid geometric pattern (Gartley, Butterfly, or ABCD) that also passes the general trend filter, an initial very high strength of 95.0 is assigned.
2. Increase by cross-confirmation (Signal Coordinator): Through the signal coordinator (cSignalCoordinator), the system simultaneously verifies the results of the harmonic pattern scanner and the technical analysis. If both strategies agree on the same direction (e.g., the harmonic pattern indicates "Buy" and technical analysis also does), the system adds a "bonus" of 10.0 points to the signal strength. This sum has a maximum limit or cap of 100.0.
3. Final Validation: Before opening a trade in the market, the ValidateSignal function compares the resulting strength with the MinSignalStrength parameter (80.0 by default). If the calculated signal strength is below that minimum threshold, the system prints a message "Signal Rejected: Insufficient Strength" and does not open the trade.
Risk Management and Contingency Protocols cRiskManage
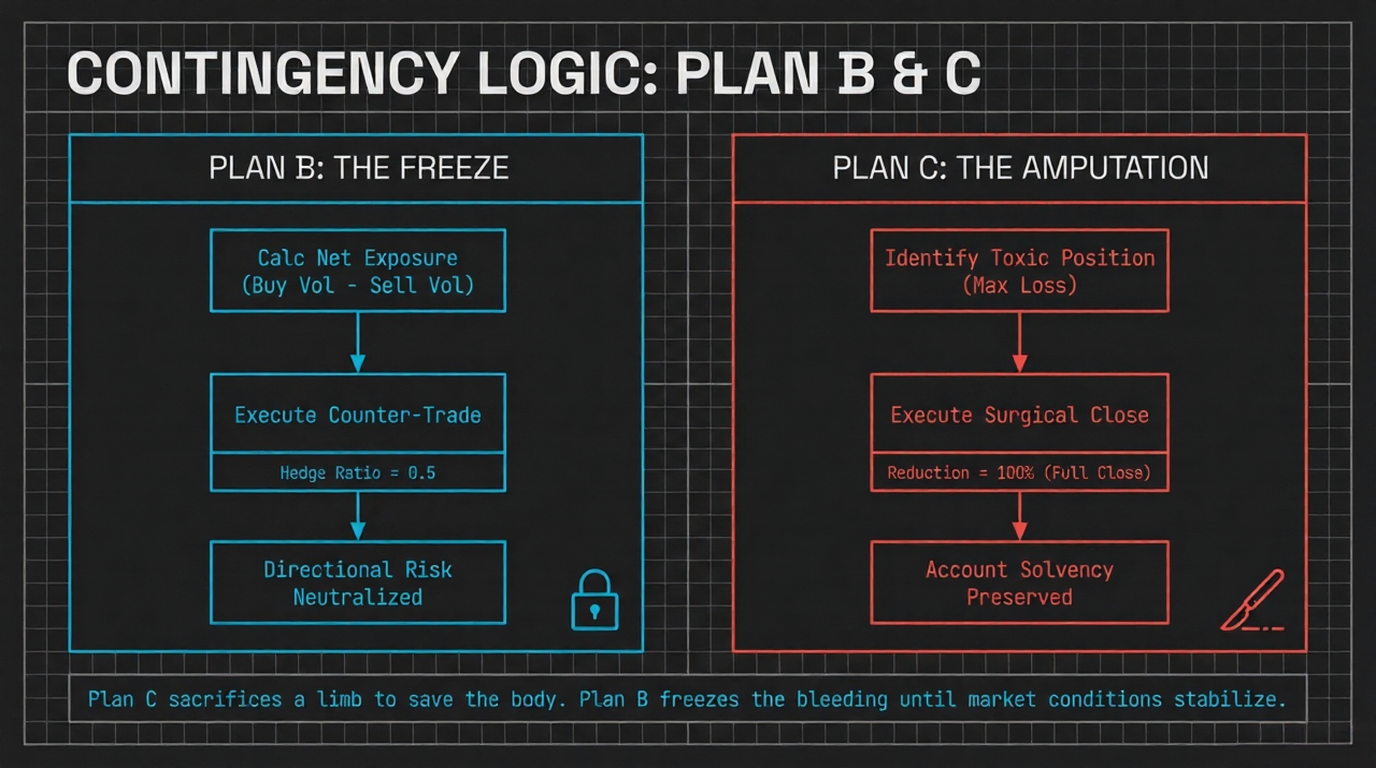
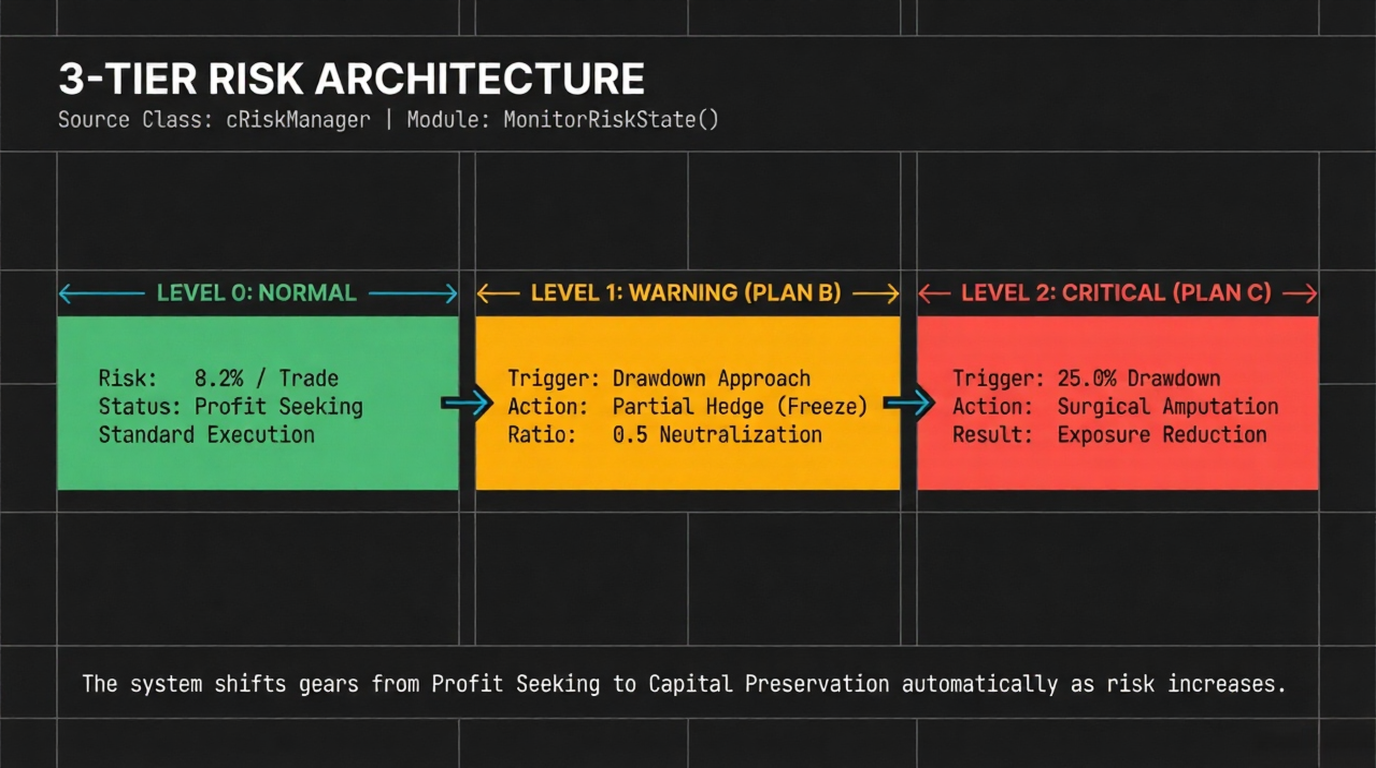
Contingency plans B and C are advanced mechanisms of the risk manager (cRiskManager) designed to protect the account's capital when floating losses (Drawdown or DD) reach dangerous levels.
The system constantly monitors the Drawdown percentage (the difference between balance and current equity) and activates these plans automatically as follows:
Plan B (Risk Level: Warning) Activated when Drawdown exceeds the configured threshold (PlanB_DD_Threshold). Its calculation objective is to stop the fall through hedging and risk reduction:
1. Smart Hedge: The system calculates net market exposure (the total volume difference between buy and sell positions). Then, it automatically opens a trade in the opposite direction for a fraction of that volume, determined by the PlanB_HedgeRatio ratio (default is 50% or 0.5). This serves to partially "freeze" the Drawdown.
2. Lot Reduction: While Plan B is active, the system halves (50%) the allowed lot size for any new trade attempted to be opened.
Plan C (Risk Level: Critical) Considered the system's last resort and activated if Drawdown reaches an even more extreme limit (PlanC_DD_Threshold). It works as a "surgical amputation" to avoid blowing the account:
1. Selective Closing of Toxic Positions: The system tracks all open trades, identifies the one generating the greatest monetary loss, and closes it. Depending on the PlanC_ReductionPercent parameter (default 100%), it closes it in its entirety or does a partial close to alleviate the margin.
2. Total Lock: During the critical level, the risk manager enters a preservation mode where it temporarily blocks the opening of any new trade, forcing lot calculation to 0.
Both plans include a safety limit in their execution (only allowing 1 action per minute) to avoid order saturation or an infinite loop in high volatility situations.
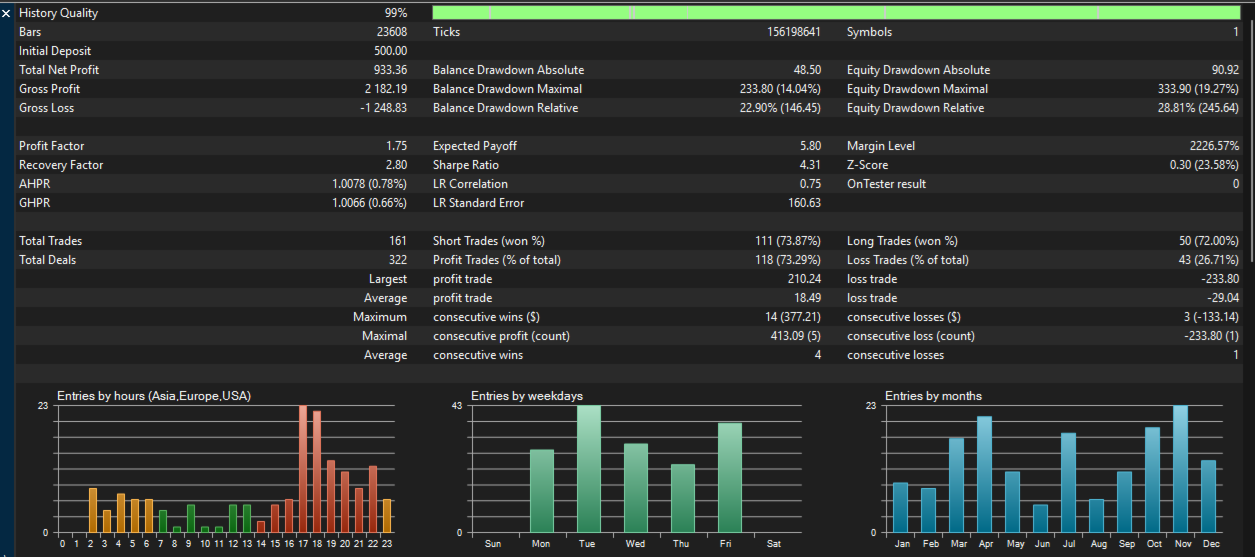
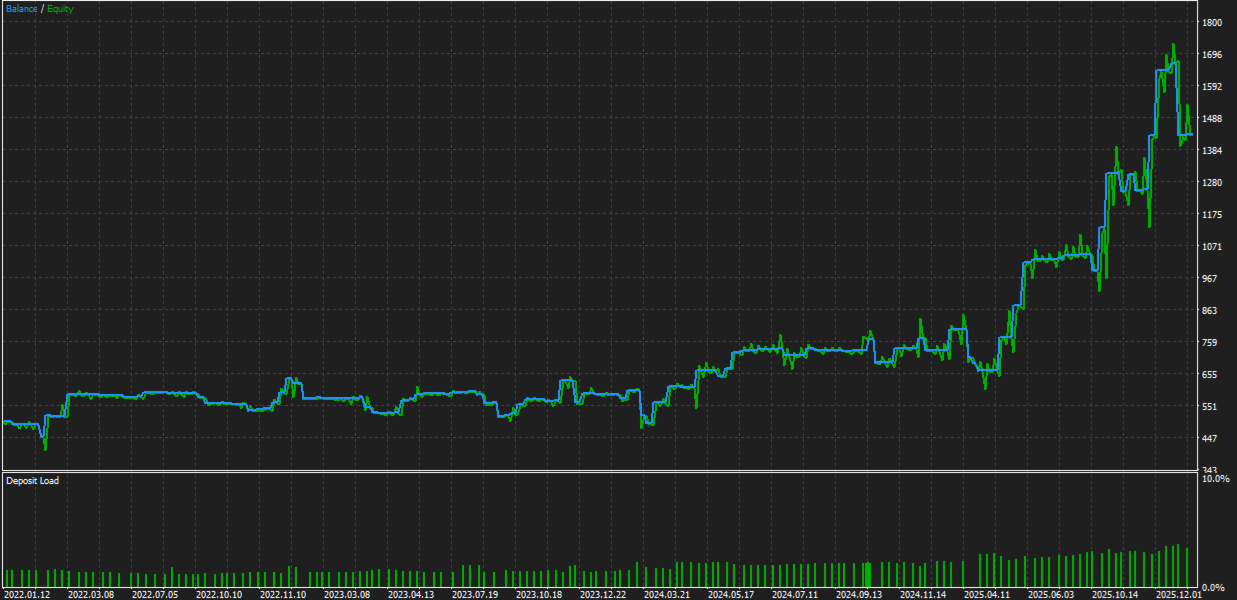
Performance analysis of the FUSION HARMONIC INTELLIGENCE system, evaluated through the strategy tester on the XAUUSD (Gold) pair on a 1-hour (H1) timeframe for the period from January 1, 2022, to December 31, 2025, shows very solid and consistent results.
The breakdown analysis by key metrics is detailed below:
1. General Profitability
Capital Growth: The system started with an initial deposit of $500.00 and achieved a total net profit of $933.36. This means it nearly tripled the account's initial balance during the testing period.
Gross Profit and Loss: Generated a gross profit of $2,182.19 against a gross loss of -$1,248.83.
Profit Factor: Stands at 1.75. This is an excellent metric indicating that for every dollar the system loses, it is capable of generating $1.75 in profits.
2. Trade Efficiency and Reliability
Win Rate: Out of a total of 161 trades performed, the system won 118, representing a very high win rate of 73.29%. Losing trades represented only 26.71% (43 trades).
Performance by Direction: The system was slightly more effective trading short (sells), with a 73.87% win rate in its 111 trades, compared to a 72.00% win rate in its 50 long trades (buys).
Winning vs Losing Streaks: The average of consecutive wins is 4 trades, while the average of consecutive losses is only 1. The maximum winning streak reached 14 consecutive trades, and the worst losing streak was limited to 3.
Risk/Reward Ratio per Trade: Average profit per winning trade is $18.49, while the average loss is -$29.04. Although average loss is greater than average profit, the high win rate (73.29%) more than compensates for this difference, keeping the system highly profitable. The largest individual gain was $210.24 and the worst loss was -$233.80.
3. Risk Management and Stability
Drawdown (Capital Reduction): The system controlled risk effectively. Equity Drawdown (floating) was 19.27% ($333.90), and Balance Drawdown was 14.04% ($233.80). Keeping Drawdown below 20% is generally considered conservative to moderate risk management.
Sharpe Ratio: Obtained an outstanding rating of 4.31. A Sharpe Ratio above 3 is considered excellent, indicating that the performance obtained is extraordinarily high in relation to the risk assumed in each trade.
Recovery Factor: Sits at 2.80. This demonstrates the system has a good capacity to recover and generate new historical highs in the account after suffering its worst loss streak (Drawdown).
In conclusion, the report reflects that the system is a highly precise algorithm that prefers to secure small and medium profits with high frequency, keeping losing streaks very short and protecting capital from deep falls, resulting in constant balance growth and a very favorable overall risk-reward ratio.
RISK AND IMPORTANT NOTICE
Fusion Harmonic Intelligence must be strictly evaluated as a long-term trading system. Short-term performance observations, limited trade samples, or brief equity curve analyses do not reflect the system's intended operational profile. Market conditions continuously evolve, and the strength of Fusion Harmonic Intelligence lies in its adaptability and structural resilience over time. This system is not designed for a short-term presentation; it is designed for sustained deployment.
Trading involves considerable financial risk, and past performance does not guarantee future results. Users should only trade with capital they can afford to lose and it is strongly recommended to start with conservative settings, especially during the initial implementation period. No automated trading system can eliminate risk entirely; Fusion Harmonic Intelligence is designed to manage and control risk exposure, not eliminate it.
If any system behavior, parameter, or setting is unclear, users should not guess or modify settings arbitrarily. Incorrect configuration can significantly impact system performance and risk exposure. If you need help, please contact us. Proper understanding of the system allows for appropriate use and more consistent results.
Fusion Harmonic Intelligence is not designed for short-term speculative trades or promotional performance metrics. It is designed to function as a disciplined, selective, and adaptable trading system, reflecting professional standards of risk management and long-term capital investment. For traders seeking a solid trading solution based on robust logic, controlled risk, and long-term viability, Fusion Harmonic Intelligence is designed to meet that goal.
Trading in financial markets involves a high level of risk and may not be suitable for all investors. The high degree of leverage can be detrimental or beneficial to you. Past performance does not guarantee future results. The use of Fusion Harmonic Intelligence is at the sole discretion and risk of the user/client.
INVERJAAG is not responsible for financial losses derived from the use of this software.