Watch the Market tutorial videos on YouTube
How to buy а trading robot or an indicator
Run your EA on
virtual hosting
virtual hosting
Test аn indicator/trading robot before buying
Want to earn in the Market?
How to present a product for a sell-through
Technical Indicators for MetaTrader 4 - 152

Balance Levels is an easy-to-use trading indicator that provides clear buy and sell signals along with dynamic price levels, helping traders plan their entries and exits with more confidence. The tool is highly flexible – it can be used as a standalone strategy or integrated into any existing trading system. It works on all timeframes and across all markets: Forex, Gold, Indices, Crypto, or Stocks. Balance Levels suits every trading style – from scalping and intraday, to swing trading and even

Super Signal Series – V19 PRO Golden Trend Matrix Signals— Multi-Filter Trend & Momentum Indicator (H1/H4)
Exclusive Bonus When you purchase this indicator, you receive 2 professional Gold EAs: MT4 Gold EA
XAU Trend Matrix EA – Worth $150 : See the EA https://www.mql5.com/en/market/product/162870 MT5 Gold EA
XAU Steady Gain Pro – Worth $150 : See the EA https://www.mql5.com/en/market/product/162861 Total Bonus Value: $300
Turn noisy charts into clean, tradeable signals. Golden Tre

TrendCatcher FVG is an indicator for traders who follow Smart Money Concepts (SMC).
It detects Fair Value Gaps (FVG, ICT three-candle pattern), plots the gap box and the Central Line (CE, 50%), and displays reference levels (Entry, Stop Loss, Take Profit 1 and Take Profit 2) directly on the chart. The tool is designed as a visual aid and does not place or manage orders. How It Works The indicator scans each bar and identifies bullish or bearish Fair Value Gaps using either wicks or bodies, depe

Super Signal Series – V20 PRO Momentum Matrix Pro – Multi-Strategy Signal Dashboard
Exclusive Bonus When you purchase this indicator, you receive 2 professional Gold EAs: MT4 Gold EA
XAU Trend Matrix EA – Worth $150 : See the EA https://www.mql5.com/en/market/product/162870 MT5 Gold EA
XAU Steady Gain Pro – Worth $150 : See the EA https://www.mql5.com/en/market/product/162861 Total Bonus Value: $300
Momentum Matrix Pro is a powerful multi-symbol, multi-strategy dashboard indicator

EMA Volume Confluence Indicator - Overview What It Does: This is a multi-timeframe momentum indicator that combines trend following, volume analysis, and volatility bands to identify high-probability trade setups. Core Components: EMA 7 (Blue) - Fast trend line EMA 21 (Orange) - Slow trend line VWAP (Purple) - Volume-weighted average price (institutional level) ATR Bands (Red/Green) - Volatility channel around EMA 21 Info Panel - Real-time metrics (RSI, volume ratio, trend, positions) Signal Log

Super Signal Series – V11 PRO Ultimate Trend-Following Scanner
Exclusive Bonus When you purchase this indicator, you receive 2 professional Gold EAs: MT4 Gold EA
XAU Trend Matrix EA – Worth $150 : See the EA https://www.mql5.com/en/market/product/162870 MT5 Gold EA
XAU Steady Gain Pro – Worth $150 : See the EA https://www.mql5.com/en/market/product/162861 Total Bonus Value: $300 Are you tired of manually flipping through dozens of charts, desperately searching for the next big trend

NPerdana – N Pattern Detector Indikator NPerdana otomatis mendeteksi area ranging atau yang biasa disebut dengan pola N pada chart, terutama saat harga bergerak membentuk area ranging , lalu menandainya di chart dengan kotak sederhana. Dengan ini, trader bisa cepat melihat area ranging atau yang biasa disebut dengan pola N sebelum kemungkinan terjadi breakout. Rasio Lebar Area Ranging – menentukan seberapa besar lebar area ranging yang ditampilkan. Jumlah Candle Ranging – menentukan jumlah mi
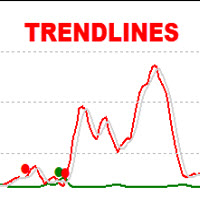
The Trendlines Oscillator helps traders identify trends and momentum based on the normalized distances between the current price and the most recently detected bullish and bearish trend lines.
The indicator features bullish and bearish momentum, a signal line with crossings, and multiple smoothing options. USAGE The Trendlines Oscillator works by systematically: Identifying pivot highs and lows. Connecting pivots to form bullish (support) and bearish (resistance) trendlines. Measuring

Super Signal Series – V9 PRO Price Action Strategies Dashboard – Multi-Pair Signal Scanner (Buy/Sell with Entry, SL & TP)
Exclusive Bonus When you purchase this indicator, you receive 2 professional Gold EAs: MT4 Gold EA
XAU Trend Matrix EA – Worth $150 : See the EA https://www.mql5.com/en/market/product/162870 MT5 Gold EA
XAU Steady Gain Pro – Worth $150 : See the EA https://www.mql5.com/en/market/product/162861 Total Bonus Value: $300
The Price Action Strategies Dashboard is a

Super Signal Series – V18 PRO Advanced Supply & Demand Zone Dashboard
Exclusive Bonus When you purchase this indicator, you receive 2 professional Gold EAs: MT4 Gold EA
XAU Trend Matrix EA – Worth $150 : See the EA https://www.mql5.com/en/market/product/162870 MT5 Gold EA
XAU Steady Gain Pro – Worth $150 : See the EA https://www.mql5.com/en/market/product/162861 Total Bonus Value: $300
The Ultimate Multi-Symbol, Multi-Strategy Scanner for Price Action Traders Description Tired of

Trend Reversal Catcher with Alert MT4 Trend Reversal Catcher with Alert MT5 is a non-repainting, non-redrawing, and non-lagging price action indicator designed to identify precise market turning points.
It combines pivot detection , candlestick patterns (pin bars and engulfing setups), and an ATR-based volatility filter to deliver clean and reliable reversal signals. MT5 version https://www.mql5.com/en/market/product/150541?source=Site +Market+My+Products+Page The indicator p

TR CPR Full Lines Pivot — Full Pivot Range Indicator
A professional indicator that automatically plots CPR (Central Pivot Range) levels on Daily (D1) or H4 timeframe , with clean lines and structured targets ( TP1 – TP3 ) for both upside and downside. It helps you identify clear BUY / SELL zones , with smart alerts when price touches or breaks key levels.
Features: Automatic CPR calculation from previous Daily or H4 candle. Clean lines for BUY / SELL / PP (Pivot) . TP1 – TP3 targets displayed
H4 Supersignal
Welcome to my page.
- The H4 Supersignal indicator is created for the H4 timeframe.
- The indicator does not repaint.
- It can be tried on other timeframes.
- It works on all currency pairs.
- Bollinger Bands (60, 2) or moving averages (60 Smoothed) can be attached to the chart as a visual aid.
- Trading signals are displayed by white and yellow arrows in accordance with the blue and red trend lines.
Good luck!
MTF Chart PRO: Multi-Timeframe Analysis with Patterns, S/R, and Alerts Overview MTF Chart PRO is an advanced MetaTrader 4 indicator that overlays customizable candles from multiple timeframes directly on your current chart, enabling seamless multi-timeframe (MTF) analysis without switching windows. Ideal for forex, stocks, and crypto traders, it combines visual candle display with built-in support/resistance (S/R) lines, automated SL/TP levels, candle pattern detection, and configurable alerts—e
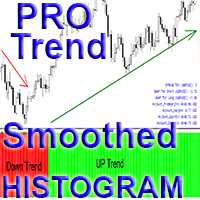
Crypto_Forex Indicator "Pro Smoothed Trend Histogram" for MT4, No Repaint.
- Pro Smoothed Trend Histogram indicator is much more efficient than any standard Moving Averages cross. - It is especially focused for big trends detection. - Indicator has 2 colors: Red for bearish downtrend and Green for bullish uptrend (colors can be changed in settings). - With Mobile and PC alerts. - It is great idea to combine this indicator with any other trading methods: Price Action, Scalping, Momentum trading
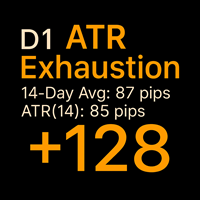
Description: This lightweight MT4 indicator calculates and displays how far price has travelled today (in pips) from the daily open to its furthest extreme (high or low) — giving you a clear picture of true daily range exhaustion , not just current position. Unlike traditional ATR-based tools that focus on close-to-close movement, this version measures maximum intraday excursion , making it ideal for volatility analysis , range exhaustion detection , and intraday risk management . Key Feat

Fusion Cross is a modern arrow indicator for MetaTrader 4 that combines the power of several proven tools:
WPR (Williams Percent Range)
RSI (Relative Strength Index)
Their combination generates highly accurate market entry signals, rejecting false signals and displaying only those points where the probability of a reversal or continuation of the movement is truly high.
Key Features:
Clear buy and sell arrow signals directly on the chart.
Instant notifications:
sound alert,
emai

Igniter Indicator for gold turns market push into a clear green/red histogram. When momentum strengthens, it prints green; when it fades, it prints red. Signals are based on closed candles, so what you see is what you can act on—no guesswork and no tinkering with hidden recipe settings. It’s built for manual traders who want a steady, reliable read without learning a new language.
Using it is straightforward: wait for a color flip and enter in that direction. Flips that carry through the zero

Step into the world of Forex trading with confidence, clarity, and precision using Gold Indicator a next-generation tool engineered to take your trading performance to the next level. Whether you’re a seasoned professional or just beginning your journey in the currency markets, Gold Indicator equips you with powerful insights and help you trade smarter, not harder. Built on the proven synergy of three advanced indicators, Gold Indicator focuses exclusively on medium and long-term trends eli
Trade Signals & Session Bias in one tool. Detects Asia, London & NY session trends, shows bias strength, alerts bias flips, and plots entry/SL/TP levels with R:R. Simple dashboard for quick decisions. Simple but powerful trading assistant. This indicator automatically detects the market bias during the Asia, London, and New York sessions .
It helps traders stay on the right side of the trend, avoid neutral zones, and catch bias flips with alerts. Bias Detection – Shows session bias as

H4 - Scalping
- This indicator has a high earning potential and is created for the H4 timeframe, but can also be used on higher timeframes.
- The indicator does not repaint and works on all currency pairs.
- With the help of moving averages or other preferred indicators, losses can be minimized.
- Trading signals are displayed by white and yellow arrows.
- I have noticed that exits of 30 pips with Stop Loss of 30 pips give good results. Or exits at crossings of moving averages 5 and 36 LWM

The Real Flow Defense Levels indicator is a proprietary tool designed to identify and plot significant, high-conviction price zones directly onto your main trading chart. It uses a dynamic, volume-based analysis to determine where the market has previously demonstrated the strongest defense or concentration of activity . These plotted lines serve as dynamic support and resistance levels , highlighting the prices where major participants are most likely to enter or defend their positi

The MarketProfileTPO indicator for MetaTrader 5 is a powerful tool designed to bring the Market Profile concept, based on Time Price Opportunity (TPO) analysis , directly onto your main chart window. This indicator calculates and displays the price distribution over a specified period, highlighting key areas of market activity and concentration. It is particularly optimized for high-volatility instruments like NAS100, US30, and XAUUSD when used on the M1 (1-minute) timeframe, offer
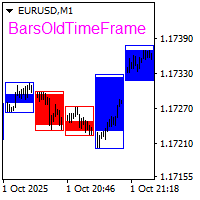
The BarsOldTimeFrame indicator is designed to analyze bar formation on a higher timeframe, projecting bars from it onto the current timeframe.
The indicator draws higher timeframe bars on the current chart as rectangles with filled candlestick bodies and transparent shadows. The higher timeframe and fill colors for bullish and bearish bar bodies are selected in the settings.

EMA indicator based on BTMM In BTMM, common EMA colors include Yellow for EMA 5, Red for EMA 13, Light Blue/Aqua for EMA 50, White for EMA 200, and Dark Blue for EMA 800. These color-coded EMAs represent different market timeframes and are used to identify trends, potential reversal points, and areas of support and resistance. consist of
Yellow (Mustard): EMA 5 Red (Ketchup): EMA 13 Light Blue (Water): EMA 50 White (Mayonnaise): EMA 200 Dark Blue (Blueberry): EMA 800 White

Entry workflow Determine trend by channel slope and price position relative to the midline . Trigger: Fibo-3 (yellow by default) + intersection with the channel (projected or already occurring / retest). Entry in trend direction — after a Fibo-3 retest or a candlestick confirmation near the intersection zone. Stop-loss: one Fibo-3 level beyond the entry (long — below, short — above). Take-profit: next significant level/channel boundary or the expected intersection zone. Timing: check how many ba
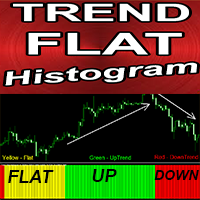
Crypto_Forex Indicator "Trend Flat Histogram" for MT4, No Repaint.
- Trend Flat Histogram indicator is very sensitive and much more efficient than any standard Moving Averages. - It is designed to show current market conditions: Flat, Uptrend, Downtrend. - Indicator has 3 colors: Yellow for Flat market conditions, Red for downtrend and Green for uptrend (colors can be changed in settings). - With Mobile and PC alerts. - It is great to combine this indicator with any other trading methods: Pri
Advanced Currency Strength Indicator Comprehensive Market Analysis in One Tool User-Friendly and Versatile for All Traders This indicator simplifies market analysis by evaluating the strength of 28 forex currency pairs, along with Gold, Silver, and other selected instruments. By using a Triangular Moving Average (TMA) and ATR-based bands, it provides a structured view of market movements, assisting traders in making informed decisions.
Identify Market Trends Efficiently The indicator helps ass
Trend Pro: Market Trend Analysis Tool Key Features Smart Signal Analysis Provides structured BUY/SELL signal insights Helps detect potential trend reversals Assists in exit point identification Offers real-time market condition tracking Advanced Visual Analytics Color-coded trend strength representation Dynamic trend momentum evaluation Market volatility tracking system Noise reduction filtering for clarity Performance Benefits Designed for efficient signal processing Developed to improve signa
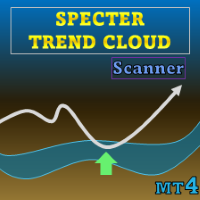
Special offer : ALL TOOLS , just $35 each! New tools will be $30 for the first week or the first 3 purchases ! Trading Tools Channel on MQL5 : Join my MQL5 channel to update the latest news from me Specter Trend Cloud is a moving-average–based trend visualization tool designed to highlight market direction and key retest opportunities. By combining adaptive averages with volatility adjustment, it creates a colored “cloud” that flips with trend changes and tracks how price interacts
Smart Regression Bands – Precision Trend & Touch Detection System Trade with confidence using the Smart Regression Bands Indicator — a non-repainting regression-based system built for traders who want clarity, precision, and accuracy in their setups. Whether you’re a beginner , scalper , or professional swing trader , this tool fits perfectly into any intraday , swing , or smart money (SMC) strategy. What It Does The indicator intelligently detects every candle that touches the upper or lower

Green Days was created to eliminate confusion around the concept of "smart money" by turning structural shifts like BOS (Breakout of Structure) and CHoCH (Change of Character) into simple buy and sell trading signals. It simplifies structure-based trading by automatically recognizing breakouts and reversals as they occur, allowing traders to focus on execution rather than analysis. Whether the market is continuing a trend or preparing for a reversal, the indicator transforms complex price dynam
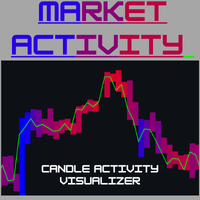
The Candle Activity Visualizer turns your chart into a dynamic heatmap, giving you a clear view of buying and selling pressure. In-Depth Market Insight: Active Zone Detection: The algorithm highlights areas where high volume builds up within a narrow price range, revealing key pressure zones. Real-Time Intensity: Colors adjust in real time, shifting smoothly from cool tones to warmer shades as activity increases. Visual Customization: 5 Color Palettes: Choose from five professionally designed th

Rainbow Price Visualizer v1.21 See where the market really breathes.
Turns your MT4 chart into an ultra-precise heatmap that highlights price zones favored by big players. Why it matters 300 price levels at 0.2‑pip resolution — microscopic detail. 8 visual themes (Rainbow, Fire, Ocean…) for instant readibility. Smart opacity: low noise fades, real zones pop. Lightweight rendering with automatic cleanup. Fully customizable: saturation, opacity, resolution, history depth. Bands project into the f

Stop chasing the market. The Follow Line Indicator provides clear, high-probability signals right on your chart. This advanced tool features a Dynamic Trend Line that instantly adapts to market structure. It’s your immediate visual reference: Blue means you're in an uptrend, and Red signals a downtrend. The core function tracks price extremes and volatility to define the true trend strength. The best part is the automatic signal generation: Buy Arrow: Appears when the trend line flips from Red t

Smart Structure Pro (SMC) Multi-Timeframe Market Structure Mapping for Smart Money Traders Overview Smart Structure Pro (SMC) is a professional-grade market structure indicator designed for traders who follow Smart Money Concepts (SMC) .
It automatically identifies and plots Break of Structure (BOS) , Change of Character (CHoCH) , Inducement zones , and major swing structure levels (HH, HL, LH, LL) — giving you a clear, systematic view of price flow and liquidity behavior. With its unique mul

https://linktr.ee/ARFXTools
ARFX QUANTUM WAVE TRADING FLOW 1. Identify the Main Trend Activate the ARFX Quantum Wave Indicator on your chart. Observe the main signal direction — Buy or Sell . The wave thickness indicates trend strength — the thicker the wave, the stronger the trend. Focus only on the dominant direction shown by the indicator. 2. Use Price Action Patterns for Entry Enter trades following the Quantum Wave signal , confirmed by a Price Action Pattern ar
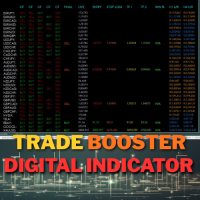
Digital Indicator version 7.0 is designed to GOLD, Oil, Indices, Crypto, FOREX trading. With Zero ideas and Knowledge of trading you can make a vey handsome profit with this Indicator on daily basis.
Digital Indicator v7.0 is highly advanced with high accuracy. Here i have added direct Current Live Price, Entry Price, Stop Loss, Take Profit 1, Take Profit 2, H1 Support n Resistance, H4 Support n Resistance .
In this version i have added AI enabled WIN% probability which will show the win

OSMA Indicators Translation
The OSMA Indicators identify moments when market sentiment may change by linking RSI signals with price action. When the RSI breaks through a preset threshold (the default midline of 50), the indicator directly plots divergences on the chart. These divergences mark areas where sentiment has reversed and can be regarded as effective support or resistance levels.
Check MT4 Version: OSMAIndicators MT4 OSMAIndicators
More Products: OSMAIndicators When the RSI breaks th

ZoneDominator AI — Adaptive Multi-Timeframe Support & Resistance Indicator Overview ZoneDominator AI is an advanced analytical indicator that continuously scans all timeframes to locate the most accurate and relevant Support & Resistance zones.
It uses a unique combination of ATR volatility, Moving Averages, Price Action, and higher-timeframe confirmation to adapt in real time to market structure. You can choose your preferred trading style — Scalping, Intraday, or Swing — and the indicat
%R TREND EXHAUSTION INDICATOR - USER GUIDE The indicator displays three Williams %R lines (Fast, Slow, Average) in the range from 0 to -100 and generates visual signals when extreme zones are reached.
INDICATOR ZONES Overbought zone: above -20 Middle zone: from -20 to -80 Oversold zone: below -80 TRADING SIGNALS ARROW UP (blue) - MAIN BUY SIGNAL Appears when both lines (Fast and Slow) simultaneously exit the oversold zone. Indicates upward trend reversal, exh

Super Signal Market Slayer
No Repaint | High Accuracy | Multi-Market Intelligent Trend Indicator In trading, the real challenge is not placing an order,
but clearly seeing when a trend has truly begun amid market noise. Market Slayer was created for this purpose. It is a no-repaint intelligent indicator designed specifically for intraday trading.
Through multi-layer confirmation and trend-filtering logic, it delivers clear and reliable Buy / Sell signals only at key moments. Key Advantages No r

PipsZenith Virtual Candle Levels – Indicator Description Take your trading to the next level with PipsZenith Virtual Candle Levels – the ultimate multi-timeframe support and resistance tool. This powerful indicator plots High, Low, Open, and Close levels from multiple standard and custom timeframes, helping traders identify key market zones with precision. Unlike ordinary indicators, PipsZenith Virtual Candle Levels lets you see levels from: Yearly, 6-Month, 4-Month, 3-Month, 2-Month Monthly, We

Asset Fortress Signal Indicator v1.26 - Professional Trading System Asset Fortress Signal Indicator Professional MT4 Signal System for Beginners & Advanced Traders Core Philosophy: PATIENCE IS PROFIT Asset Fortress is designed around one fundamental principle: successful trading requires patience. This indicator doesn't just provide signals – it teaches you to wait for the RIGHT signals. Every feature is built to help you develop the discipline that separates profitable traders from the rest

Super Signal Series – V17 PRO Fibonacci Pro Dashboard: The Ultimate 10-in-1 Trading Tool
Exclusive Bonus When you purchase this indicator, you receive 2 professional Gold EAs: MT4 Gold EA
XAU Trend Matrix EA – Worth $150 : See the EA https://www.mql5.com/en/market/product/162870 MT5 Gold EA
XAU Steady Gain Pro – Worth $150 : See the EA https://www.mql5.com/en/market/product/162861 Total Bonus Value: $300
Are you tired of endlessly flipping through dozens of charts, trying to find

Super Signal Series – V14 PRO Harmonic & Trend Signal Dashboard: Your All-in-One Forex Trading Panel Exclusive Bonus When you purchase this indicator, you receive 2 professional Gold EAs: MT4 Gold EA
XAU Trend Matrix EA – Worth $150 : See the EA https://www.mql5.com/en/market/product/162870 MT5 Gold EA
XAU Steady Gain Pro – Worth $150 : See the EA https://www.mql5.com/en/market/product/162861 Total Bonus Value: $300 Stop switching between dozens of charts and missing high-probabili

Trend Movement Indicator Pro Precision. Clarity. Control. Trend Movement Indicator Pro is a next-generation analytical system that combines signals from 10 key technical indicators into one visual panel.
It’s designed for traders who make decisions based on objective data rather than emotions .
This tool does not attempt to predict the market — it reveals the current trend structure and strength of movement across multiple timeframes, helping traders act in the direction of real market momentum
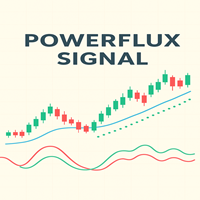
PowerFlux Signal — a powerful arrow indicator without redrawing
PowerFlux Signal is a modern arrow indicator designed for traders who value accuracy, simplicity, and timely signals. Developed based on the intersection of exponential moving averages (EMA), it instantly captures moments of trend reversal and provides clear visual signals to buy or sell.
️ How PowerFlux Signal works
The indicator is based on a classic but improved formula for the interaction of two EMAs — Fast EMA and Slow EMA.

Dear traders this is Our new Indicator called Hull Pro MTF Indicator — Precision Multi-Timeframe Trend Visualizer
Overview The Hull Pro MTF Indicator is a next-generation Heiken-Ashi-based multi-timeframe visual tool designed for top-down market analysis . It blends the power of Hull Moving Average (HMA) logic and multi-level Heiken-Ashi smoothing to reveal directional bias, volatility ranges, and price symmetry across hourly, daily, weekly, monthly, and yearly structures — all in a single c
Hull Max MTF Indicator — Advanced Multi-Timeframe Market Analyzer Overview The Hull Max MTF Indicator is a professional-grade technical analysis tool built for serious traders who perform multi-timeframe (top-down) market analysis . It combines the speed and precision of the Hull Moving Average (HMA) with advanced forecasting, projection zones, and adaptive visual styles — helping traders clearly understand trend alignment across hourly, daily, weekly, monthly, and yearly structures in one ch
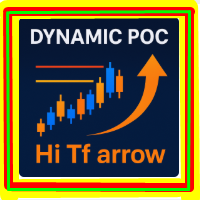
POC, Volume Profile, Market Profile, Volume Indicator, Dynamic POC, Tick Volume, Forex Volume The Dynamic POC Hi Tf Arrow indicator is a reliable volume analysis tool (volume profile, market profile, tick volume) for accurately determining POC levels and price reactions. Dynamic POC Hi Tf arrow for MT4 Description Dynamic POC Hi Tf arrow is a professional volume analysis indicator designed to accurately identify key price levels and market direction.
It is built on tick volume data and displ
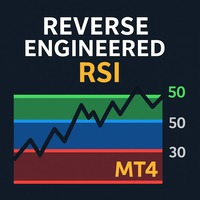
Reverse Engineered RSI Introduction Reverse Engineered RSI transforms the way traders use the RSI indicator.
Instead of displaying RSI in a separate oscillator window, this tool projects the key RSI levels — 30, 50, and 70 — directly onto the price chart . This allows traders to see where overbought, oversold, and equilibrium zones align with actual price levels — without switching charts or guessing momentum conditions.
You get precise RSI-derived support and resistance levels right on the c

Price Magnet — Price Density and Attraction Levels Indicator Price Magnet is a professional analytical tool designed to identify key support and resistance levels based on statistical Price Density. The indicator analyzes a specified historical period and detects price levels where the market spent the most time. These zones act as “magnets,” attracting price action or forming a structural base for potential reversals. Unlike traditional Volume Profile tools, Price Magnet focuses on price-time d

Super Signal Series – V8 PRO Algorithmic & Quant Strategies Signals Dashboard for MT4
Exclusive Bonus When you purchase this indicator, you receive 2 professional Gold EAs: MT4 Gold EA
XAU Trend Matrix EA – Worth $150 : See the EA https://www.mql5.com/en/market/product/162870 MT5 Gold EA
XAU Steady Gain Pro – Worth $150 : See the EA https://www.mql5.com/en/market/product/162861 Total Bonus Value: $300
Take your forex trading to the next level with the AQS Signals Dashboard, a comp
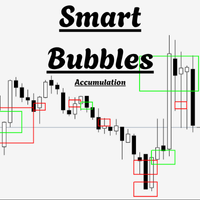
Bubble Indicator - Price Slowdown + Volume Spike Detection A simple visual tool that shows colored squares on your chart when price slows down suddenly with a volume spike. What it does: Spots moments when the market "hesitates" before a move Shows where big volume enters without moving price Helps anticipate potential breakouts How it works: Analyzes smaller timeframes than your current chart Detects unusually small candles (price slowdown) Checks for unusually high volume (volume spike) Displ
TrendHackPro – The Ultimate High/Low Peak Trend Detector
Dominate the markets with precision trend detection powered by institutional logic. TrendHackPro is a professional-grade trading indicator that combines price action, volatility, and momentum into one clean, intuitive visual system. Designed for traders who demand accuracy, clarity, and results — this is not just another moving-average tool.
Core Concept
TrendHackPro analyzes market structure through a proprietary blend of ad

AMD Adaptive Moving Average (AAMA)
AAMA is an adaptive moving average indicator for MetaTrader 4 that automatically adjusts its responsiveness based on market conditions. Main Features: Adaptive Moving Average based on Kaufman’s Efficiency Ratio – reacts quickly in trending markets and filters noise in ranging conditions Automatic detection of the 4 AMD market phases: Accumulation, Markup (uptrend), Distribution, Markdown (downtrend) Volatility adaptation via ATR – adjusts sensitivity according

Blue Quark
- Blue Quark can be used on all timeframes.
- With Blue Quark you can trade on all currency pairs.
- The indicator does not repaint.
- With the help of 200 SMA or other preferred indicators, losses can be minimized.
- Trading signals are displayed by blue and red arrows.
- The Blue Quark indicator displays very good signals on BTCUSD.
- For this indicator to work, you need to download the TMA+CG mladen NRP indicator, which you can find in the first comment.
This indicator is
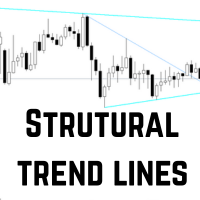
STRUCTURAL TREND LINES - MT4 Indicator
Simple indicator that automatically draws trend lines based on market structure.
Features:
- 3 degrees of structure detection (short, medium, long term)
- Configurable swing strength for each degree
- Single color per degree for clean visualization
- Adjustable number of lines per degree
- Customizable colors and line widths
How it works:
The indicator identifies swing highs and lows based on the strength parameter,
then connects these points to create t

This indicator is based on Fair Value Gap on higher timeframe and filtered by minimum RSI level with multiplier. The area is shown using Market Profile to look for better strong level for entry. How to use. When area is appeared wait for a price to touch nearest strong zone. Green is for buy and red is for sell. You can set preferable stop loss and take profit just to visualize. But it has to be not so far away from area. MinATRX - ATR multiplier to filter weak areas. MPRange - number of bars t

Volume Profile Rectangle Summary An interactive volume profile indicator that displays a horizontal analysis of traded volume at each price level within a selected area. It automatically creates a movable rectangle and shows colored bars representing bullish and bearish volume distribution. What it does: Displays horizontal volume : Visualizes the volume distribution at each price level as horizontal bars Bullish/Bearish analysis : Colors bars in green (bullish-dominant volume) or red (bearish-
What is TMA NRP 12 Indicator? TMA NRP 12 is a versatile trading indicator designed for advanced technical analysis. It's based on TMA (Triangular Moving Average) bands and enhanced with additional indicators including 100 MA, 5 EMA, and 26 EMA. What Does It Do? TMA Bands : Displays price movements as bands at 1.618 and 2.618 standard deviation levels Multi-Signal System : Detects trading opportunities through 5 different signal groups Trend Analysis : Determines trend direction using 100 MA Conf

Wick & Liquidity Zones Tracker – Advanced Gold & Forex Cluster Indicator “See Where Big Players Move — Trade Gold & Forex Like an Insider!” Liquidity Zones instantly reveals hidden liquidity clusters, swing reversals, and breakout points, giving you the edge most traders only dream of. Key Features Liquidity Zone Detection: Automatically identifies unbalanced bullish & bearish candles , marking zones where price is likely to reverse or accelerate. Cluster Analysis: Groups consecutive candles
Trend Confluence Indicator
Multi-indicator confluence scoring system for trend analysis
Trend Confluence combines four popular technical indicators (EMA, RSI, MACD, and ADX) into a single numerical score from 0 to 100, helping traders quickly identify market direction and trend strength.
Overview
This indicator assesses market conditions by analyzing the agreement between four technical components. When the indicators align in the same direction, the confluence score strengthens, providing
Multi-Timeframe Trend Sync Sync Multiple Timeframes and Trade with Trend Confluence MTTS Sync is an advanced technical indicator designed for traders seeking precision in multi-timeframe analysis. By consolidating information from multiple timeframes simultaneously, the indicator identifies points of high confluence where multiple timeframes confirm the same market direction.
MAIN FEATURES Simultaneous Multi-Timeframe Analysis
Monitor up to 16 different timeframes simultaneously Fully customi
Indicator based on tick-spread imbalance. TF:
Works on all timeframes (M1 to D1). Pair:
Compatible with Forex, indices, gold, and CFDs (auto-adjustment for JPY pairs, Gold, CFDs). Settings: TickWindow (200) – tick observation window SpreadWeight (1.5) – spread weighting factor NormalizationPeriod (20) – normalization period (z-score) Overbought / Oversold (±3.0) – alert thresholds AlertCooldown (300s) – alert cooldown period Conclusion:
The Proxy Order Flow – Imbalance Tick-Spread v2.4 detect

Quantum Balance is a modern arrow indicator that identifies key price reversal points in the market with high accuracy. It is based on a combination of WPR (Williams %R) and RSI (Relative Strength Index), which allows you to identify overbought/oversold moments and enter trades at points of maximum potential.
The indicator analyzes price dynamics and market conditions, generating signals only when several confirming factors coincide. This reduces the number of false signals and increases tradin
Boost your trading accuracy with the Binary KillerX Signal Indicator , specially designed for binary options platforms such as IQ Option, Pocket Option, Quotex , and more. This indicator works seamlessly on all timeframes , giving you clear, reliable signals without any repainting. Key Features: Non-Repainting Signals – Once a signal appears, it will never change, ensuring you trade with confidence. Universal Platform Compatibility – Works on all major binary options platforms, including MT4
Avex Pro Signal is an advanced multi-timeframe trading indicator engineered for MetaTrader 4, combining EMA Energy analysis with Trend technology to deliver precise entry signals, dynamic stop-loss levels, and optimal take-profit targets. This indicator is designed for both scalping and swing trading across all currency pairs and timeframes. Core Features Feature Details EMA Energy System 15 synchronized EMAs displaying bullish/bearish momentum with real-time visual confirmation SuperTrend Algor

Z-Corr — это инструмент, разработанный для анализа корреляции между двумя валютными парами. Индикатор в реальном времени отображает отклонения в движении инструментов, помогая трейдеру определить моменты, когда валютные пары начинают расходиться, и своевременно открыть позицию для получения прибыли на их последующем схождении. Основные возможности: Отображает два инструмента и сравнивает их движение. Линии и гистограммы показывают текущую динамику отклонения пар. Жёлтая гистограмма сигнализирует
The MetaTrader Market is the best place to sell trading robots and technical indicators.
You only need to develop an application for the MetaTrader platform with an attractive design and a good description. We will explain you how to publish your product on the Market to offer it to millions of MetaTrader users.
You are missing trading opportunities:
- Free trading apps
- Over 8,000 signals for copying
- Economic news for exploring financial markets
Registration
Log in
If you do not have an account, please register
Allow the use of cookies to log in to the MQL5.com website.
Please enable the necessary setting in your browser, otherwise you will not be able to log in.