Watch the Market tutorial videos on YouTube
How to buy а trading robot or an indicator
Run your EA on
virtual hosting
virtual hosting
Test аn indicator/trading robot before buying
Want to earn in the Market?
How to present a product for a sell-through
Technical Indicators for MetaTrader 4 - 149

BINARYEXPERT is a powerful technical indicator developed for traders seeking precise entry signals in the binary options market. Built for MetaTrader 4, it combines several technical indicators, including EMAs, RSI, MACD, Stochastic, and ATR, to generate reliable CALL and PUT signals. With a user-friendly interface and real-time statistics panel, BINARYEXPERT assists in making more informed decisions. Main Features Multi-Indicator Analysis: Uses EMA, RSI, MACD, Stochastic, and ATR for robust si
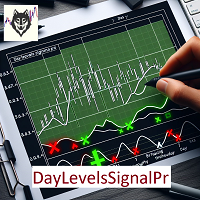
The MT4 " DayLevelsSignalPro " indicator . Signal Indicator – generates the most accurate buy / sell signals . Noise filtering indicator – reduces false signals . Signal information with a clear , understandable and visually convenient view . User- friendly graphical interface ( colors , sound notifications , customization options ) . - Generation of a breakdown signal for significant peaks of the Current day . - Generation of a signal for the breakdown of the previous Day 's Level - Generation

Turbo Scalper Pro Fast. Smart. Reliable.
The ultimate scalping companion built for serious traders who love precision and style! What Is It? Turbo Scalper Pro is a powerful non-repainting scalping indicator based on a time-tested strategy:
EMA crossover
RSI filter
Session time filtering for smarter signals
All this, packed into a clean, modern on-screen dashboard with live signals, status lights, and a real-time clock. Key Features: Non-Repainting Buy/Sell Arrows
Accurat

Dom inate the Markets with Professional Support & Resistance Detection
50% OFF SALE FOR CHRISTMAS - LIMITED TIME
Finally , an indicator that does the heavy lifting for you. Stop squ inting at charts trying to identify support and resistance levels manually . Our Automatic SN R Indicator transforms your trading by instantly revealing the critical price levels that professional traders are watching!
Why Traders Are Switching to Automate d S
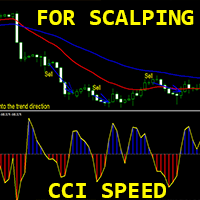
Crypto_Forex Indicator "CCI Speed" for MT4, No Repaint.
- The calculation of this indicator is based on equations from physics. CCI Speed is the 1st derivative of CCI itself. - Commodity_Channel_Index (CCI) measures the difference between the current price and the historical average price. - CCI Speed is good for scalping entries into the direction of main trend: use it in combination with any suitable trend indicators, for example EMA20 and EMA50 as it is on pictures. - CCI Speed indicator sh
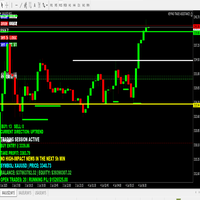
TRADING STRATEGY GUIDE DELIVERY The full Trading Strategy Guide will be sent directly to you after purchase.
Just message me on MQL5 and ask for it — you'll receive it instantly, along with priority support and setup help. Powered Market Scanner for Smart Trading Decisions Keypad Support & Resistance is a next-generation MT4 trading system built for serious traders who demand precision, reliability, and clarity. It combines advanced smart filters with real-time price structure logic to genera

This is an indicator that shows the current trend. It does not show the moment to open an order. It is a filter for your trading signals: trade only in the direction of the trend indicated by the indicator, and close orders when the trend is opposite. This indicator does not use any standard oscillators or indicators. All its calculations are based only on the prices of the last N bars of the chart. The indicator has the ability to display values from a larger timeframe chart. Features of the

Description Advanced indicator for MetaTrader 4 that identifies consecutive candle patterns and generates buy/sell signals with an optional moving average filter. Main Features Functionalities Pattern Detection : Identifies sequences of bullish or bearish candles Moving Average Filter : Option to filter signals using a moving average Visual Signals : Colored arrows indicating entry points Custom Alerts : Sound and visual notifications Intuitive Interface : Parameters organized by groups
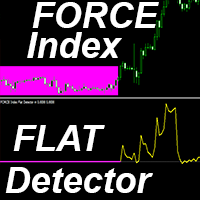
Crypto_Forex Indicator "FORCE Index FLAT Detector" - is an efficient auxiliary tool in trading! No Repaint. I offer you to upgrade your trading methods with this great indicator for MT4.
- Indicator shows price Flat areas on the chart. It has "Flat sensitivity" parameter - which is responsible for flat detection. - "FORCE Index FLAT Detector" can be used for Price Action entries confirmation or in combination with other indicators. - You can use it for trend following systems to detect flat zo

Support & Resistance Deluxe v2.20 – Your Smart Radar for Key Market Levels! A powerful indicator for demanding traders who seek precision, clarity, and reliable signals for support and resistance! What Does This Indicator Do? This is an advanced Support and Resistance indicator for MetaTrader 4 (MT4) that: Automatically scans your chart to detect the most relevant levels based on: Price highs and lows Volume (optional) Number of touches (for level validation) Plots lines and v
Quantum Core – Phase Shift is a neural synchronization engine designed for intermarket phase diagnostics.
Harnessing temporal displacement algorithms and flux harmonics, it decodes the hidden oscillatory behavior of market energy fields. The NeuroLink Trace renders the core stability vector, while the Quantum Phase Core tracks phase divergence through a smoothed temporal conduit.
Anchored to a central gravity threshold, it expands and contracts dynamically, visualizing phase shifts in real ti
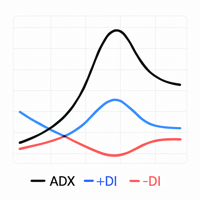
Custom ADX Indicator Based on Open Price Only The standard ADX indicator is usually calculated using the High, Low, and Close prices. This produces a smooth and visually appealing line that represents price action. However, ️ it lacks precision — as the candle moves, the ADX, +DI, and -DI values also change suddenly, potentially triggering false signals based on the candle’s initial plotting. A curious observation: even when the input is modified to use the Open price in the indicator se
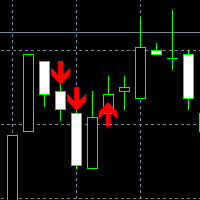
Range one indicator MT4, for any instruments and it alerts instant, suitable and works best timeframes (4H) and higher 1 . to trade as trend you will need to have Confirmation technical indicator called PARABOLIC SAR Periods step = 0.9 and Maximum = 0.2 Go buy if PSAR is Trending (if PSAR is greater then previous PSAR) and Go Sell (if PSAR is lower then previous )
2. Range one indicator is for One candle to trade when it alerts you Buy Go Buy for One candle and Sell Respectively
3 see the pi

NextGenTrend
Индикатор нового поколения, определяющий импульсные моменты для входа на основе свечной динамики и фильтрации по направлению движения. Умные стрелки только в ключевые моменты — без лишнего шума.
NextGenTrend — это профессиональный стрелочный индикатор, созданный для точного входа в рынок в строго определённых точках, когда импульс и направление совпадают. Он ориентирован на чистую, осмысленную торговлю — без визуального мусора и избыточных сигналов.
Что делает его уникальн

Unravel the mysteries of the market with MHI Probability, the indicator that transforms candlestick patterns into a breathtaking strategic compass! Featuring four distinct strategies— MHI Majority, MHI Minority, Milhão Majority, and Milhão Minority —this master of probabilistic analysis offers a unique approach to exploring the behavior of the last five candles, highlighting opportunities with stunning visual precision. Why is MHI Probability revolutionary? Four Strategies, a Universe of Possi
Fibo + ตัวจับเวลาถอยหลัง (ตัวบ่งชี้ MT4) แนวคิด: Fibo + Countdown Timer คืออินดิเคเตอร์ที่รวม เส้นแนวรับ/แนวต้านของ Fibonacci Extension เข้ากับ ตัวนับเวลาถอยหลังแบบแท่งเทียน ไว้ในเครื่องมือเดียว เหมาะอย่างยิ่งสำหรับเทรดเดอร์ที่ใช้กลยุทธ์ Price Action, Breakout หรือ Scalping คุณสมบัติ เส้นขยายฟีโบนัชชีอัตโนมัติ ตัวบ่งชี้วาดระดับการสนับสนุน/การต้านทานหลัก 4 ระดับโดยอ้างอิงจาก EMA ของราคาสูงสุดและต่ำสุด : L1 (Inner High) = EMA ของค่าสูงสุด L2 (ค่าต่ำสุดภายใน) = EMA ของค่าต่ำสุด L3 (จุดส

GANN Forecaster – Precision Tool for Forex Traders (MT4) Unleash the power of Gann analysis in your trading with this advanced, interactive indicator built specifically for MetaTrader 4. Whether you're trading Forex, Gold, Indices, or Crypto, this tool gives you a professional edge with accurate price and time projections.
Key Features GANN Projections with live Drag Reference Point automatically enables either "Up" or "Down" Gann projections based on whether the price is above or below the M
This indicator is the mql4 version of the SSLHybrid indicator. MT5 Version Find out more here: https://www.mql5.com/en/users/rashedsamir/seller
Description of TradingView version: This script is designed for the NNFX Method, so it is recommended for Daily charts only.
Tried to implement a few VP NNFX Rules
This script has a SSL / Baseline (you can choose between the SSL or MA), a secondary SSL for continiuation trades and a third SSL for exit trades.
Alerts added for Baseline entries, SSL2
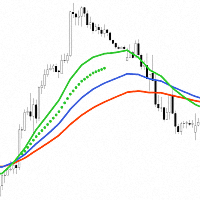
"Trend Acceleration 4" is designed to help traders navigate the market situation. The indicator shows three multi-time frame "Moving Averages" , which show the trend (tendency) of the price movement of financial instruments. They are the basis for analysis of dependencies, which with great success show the acceleration or deceleration of the trend (tendency) of the financial markets.
The choice of using three moving averages in the "Trend Acceleration 4" indicator comes from the idea of analy

VALUE EDITION LIMITED is an advanced technical indicator, developed for traders seeking clarity, precision, and speed in market analysis. Compatible with MetaTrader 4 and 5, it integrates smart overbought/oversold zones, dynamic price channels, normalized candlestick analysis, and real-time alerts, providing reliable support for trading any asset or time frame. Key Features Smart Trading Zones: Automatic identification of overbought and oversold regions, with configurable maximum, average,
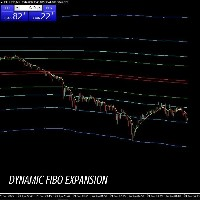
Core Components and How It Works This indicator essentially combines three main elements to provide a comprehensive view of price action: The EMA14 Line (Yellow Line) This is a Simple Exponential Moving Average calculated from the closing prices of the last 14 candlesticks. Function: Its primary role is to show short-term price trends . If the line is sloping upwards, it suggests an uptrend; if it's sloping downwards, it indicates a downtrend. The Longer EMA Lines (Two Red Lines) The indicator c
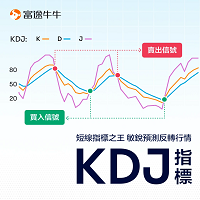
The KDJ indicator is a very useful momentum oscillation indicator made up of three indicator lines K, D, J. Many people also refer to the KDJ indicator as a “random indicator” because it actually adds a J line as an auxiliary on the basis of a traditional random indicator (containing only K, D lines). The KDJ indicator has a certain degree of comprehensiveness, drawing on the advantages of the William Indicator (WMSR) and Moving Averages (MA) to help investors better judge market trends and ide

'Naturu' is a manual indicator that uses nature’s symmetry as its algorithm.
Master the market with a simple strategy and hidden wisdom! ( This is a manual indicator and contains features that are not supported by the MetaTrader testing environment )
When you load the indicator, you’ll see two lines—Top and Bottom. Click once on a line to activate it. To move it, simply click on the candlestick where you want it placed.
You define a high point and a low point, and the indicator then calcula

Statistical Time-Based Indicator – Directional Candle This indicator analyzes all candles from the past month (30 days) on the current timeframe, identifying at which exact time (hour and minute) bullish or bearish candles occur most frequently. Based on this data, it emits real-time BUY (CALL) or SELL (PUT) signals whenever the behavioral repetition reaches the configured percentage. The statistical logic is based on exact hour and minute . For example, if at 14:15 over the last 30 day
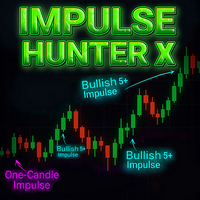
Impulse Hunter X Indicator – Professional Market Movement Radar Impulse Hunter X is a professional trading tool designed to help traders detect new, strong market impulses. It identifies and alerts you to powerful price movements, ensuring you never miss a trading opportunity. Every impulse type has been meticulously tested and refined for accuracy. Before using, make sure to configure the input parameters, especially the candle body size for stronger impulses! Key Features Detects stro
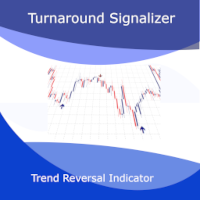
Introducing the Turnaround Signalizer: Your Competitive Edge in Trend Reversals.
Developed for the MetaTrader 4 platform, this trend reversal indicator is a robust tool for traders who aim to identify market inflection points with high probability. Its proprietary algorithm continuously analyzes price behavior, filtering out market noise to highlight the most significant shifts in direction.
Versatility for All Trading Styles
Perfect for Scalping: The Turnaround Signalizer has been optimi

How the Indicator Works MultiMarket Direction is a powerful and versatile indicator for the MetaTrader platform, designed to help traders visualize market trends and identify potential entry points. By combining time-tested technical analysis tools such as Exponential Moving Averages (EMAs) and high/low levels, this indicator provides a clear and comprehensive view of market dynamics. The indicator displays the following on the chart: EMA 21, EMA 81, and EMA 200 : Three moving averages with cust
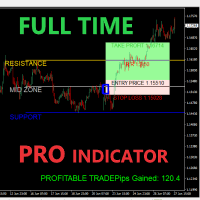
Dear traders,
Welcome to the Full Time Pro Indicator – a professional-grade trading assistant built to help you make informed decisions through a visually intelligent and highly interactive chart interface. Whether you're a beginner or an advanced trader, this guide will walk you through every feature of the indicator so you can maximize your charting experience with precision and ease.
️ Recommended Timeframe Best used on the 1-Hour (H1) timeframe
While the indicator works on all timefra

I'm not here to sell you dreams or promise you'll quit your job next month. This indicator identifies three proprietary patterns that 99% of traders have never seen before. Why? Because I discovered them myself and spent countless hours refining the detection algorithm to only show you the absolute best setups. I've included 11 real chart screenshots across different assets. Go ahead—try to spot these patterns yourself. If you can identify them without the indicator, then congratulations. You ha
*LIMITED FREE! DOWNLOAD NOW*
CDS Fractal Divergence Oscillator (AIO): The Ultimate Multi-Oscillator Divergence Tool with 15 Oscillator Options The CDS Fractal Divergence Oscillator (AIO) is a robust and highly versatile indicator engineered to empower traders in identifying crucial trend reversals and momentum shifts through advanced divergence detection. Its unparalleled strength lies in its unique ability to analyze divergence across 15 distinct built-in oscillator types and its gro
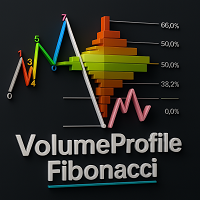
Description: Elevate your chart analysis with this advanced indicator that seamlessly integrates Zigzag structures, Fibonacci retracements, and Volume Profile insights. Designed for traders who seek clarity and precision, this tool visually identifies high-probability price patterns and market turning points.
Whether you're tracking CHOCH shifts, pinpointing POIs, or analyzing TRIPLE tops and FLAG formations, this indicator offers the depth and flexibility to adapt to any trading strategy. C
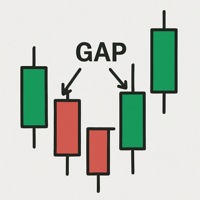
A gap is a space on the chart between two consecutive candlesticks where no trading occurred between the close of one candle and the open of the next. In the Forex market, gaps mainly appear at the weekly open, reflecting events or expectations from the weekend. Technically, a gap may indicate an imbalance between supply and demand. Strategies use gaps as signals of possible trend continuation or reversal, offering opportunities for technical analysis based on liquidity and momentum.
M1 Golding — This is an easy to use trading system. It is an arrow indicator designed for the M1-M5 time frame. The indicator can be used as a standalone scalping system, as well as as part of your existing trading system. Bonus: When you buy the indicator, you get a gift - Trend Arrow Super I also provide an additional trend filter indicator absolutely free of charge - Filter The combination of these indicators can help you make your trading easier and more accurate.
Indicator Parameters: Tre
SNR INTRADAY is a non-repainting support and resistance indicator built for intraday trading. It automatically projects horizontal levels based on the average daily percentage movement, calculated from over 20 years of historical daily candle data . The indicator is designed to help you identify high-probability entry zones , target areas , and risk levels that are likely to be reached within the same trading day .
If your broker uses symbols with suffixes (e.g., “XAUUSD.m”, “EURUSD.pro”), the
AI Driven Forex Trading Signal Indicator MT4 This advanced MT4 indicator leverages artificial intelligence to identify high-probability market reversal points with Reasonable accuracy. Designed for traders who demand precision, it analyses price action in real time and highlights optimal entry opportunities for both buy and sell trades. Suitable for all major Forex pairs and timeframes, this tool is ideal for intraday and swing trading strategies. Key Features: AI-powered reversal detection Clea
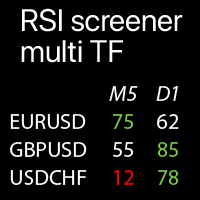
Multi-timeframe RSI values on the selected Symbols: compare the current market trends The indicator displays Relative Strength Index values from all selected timeframes and Symbols in a single table , which allows you to quickly analyze current market price trends .
My multifunctional utility : 66+ features | Contact me for any questions | MT5 version Each Symbol can be customized: removed / replaced. You can add up to 40 Symbols. Panel can be moved to any place of the chart (drag

ตัวบ่งชี้ Sniper Zones Pro - คำอธิบายการใช้งาน ตัว บ่งชี้ Sniper Zones Pro ออกแบบมาเพื่อช่วยให้ผู้ซื้อขายระบุ "โซน" ราคาที่สำคัญและจุดเข้า/ออกที่แม่นยำสำหรับการซื้อขายได้อย่างรวดเร็ว โดยมุ่งหวังที่จะเพิ่มผลกำไรสูงสุดหรือจำกัดความเสี่ยง ตัวบ่งชี้ทำงานโดยคำนวณและแสดงระดับราคาตามค่าเฉลี่ยเคลื่อนที่ถ่วงน้ำหนักเชิงเส้น (LWMA) และให้คำแนะนำในการทำกำไร (TP) และหยุดการขาดทุน (SL) แบบไดนามิก ส่วนประกอบและหลักการทำงาน: การคำนวณระดับราคา: เส้นหลัก (L2 - จุดเข้า): เส้นสีแดงนี้แสดง ค่าเฉลี่ยเคลื่อนที่ถ่วงน้
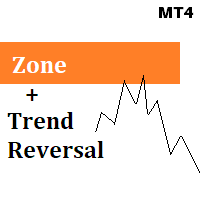
Zone + Trend Reversal System
There are many many situations you may want to use this indicator and you may not want to. Please refer the doc attached in the comment section for complete guidance. Check comments for manual. Keep in mind, Once you make the purchase please reach out to me when you are in the testing phase so i could answer your queries when you are stuck and confused because most of the time we fail because we keep going in a wrong direction without asking for the help. Read the m
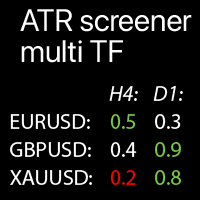
Multi-timeframe ATR values on the selected Symbols: compare the current market trends The indicator displays Average True Range values from all selected timeframes and Symbols in a single table , which allows you to quickly analyze current market price trends .
My multifunctional utility : 66+ features | Contact me for any questions | MT5 version Each Symbol can be customized: removed / replaced. You can add up to 40 Symbols. The percentage of the current ATR deviation (compared t

GANN Forecaster – Precision Tool for Forex Traders (MT4) Elevate your trading with the Gann Forecaster Scanner for MetaTrader 4. This powerful, interactive tool provides precise price and time projections, giving you a professional edge across Forex, Gold, Indices, and Crypto markets. Building on the robust functionality of the Gann Forecaster indicator, this advanced scanner offers multi-pair analysis, continuously calculating Gann levels and alerting you to optimal trade entry points. A clea
A binary options styled indicator to trade fair value gaps and line breaks. Its robust nature makes it standout from other binary options indicators. With the right setup strategy, which I will provide after purchase, you will enjoy smooth operations of the indicator. BinaryBlockBreaker is coded with third-party applications such as http://www.mt2trading.com/?ref=1341 Please signup and download the needed software to provide smooth user experience.
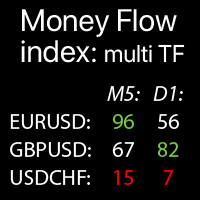
Multi-timeframe Money Flow Index: data on the selected Symbols: compare the current market trends The indicator displays MTF (Money Flow Index) indicator data from all selected timeframes and Symbols in a single table , which allows you to quickly analyze current market price trends .
My multifunctional utility : 66+ features | Contact me for any questions | MT5 version Each Symbol can be customized: removed / replaced. You can add up to 40 Symbols. Panel can be moved to any place o
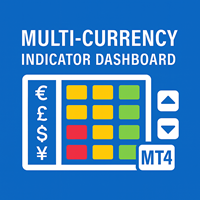
The Multi-Currency Indicator Dashboard for MT4 is an assisting tool designed to monitor up to 10 currency pairs across 6 essential indicators in one compact, color-coded dashboard. Ideal for traders who value efficiency, this tool eliminates the need to switch between charts or timeframes. Whether you're a scalper, swing trader, or trend follower, this dashboard gives you an instant visual overview of market conditions across your preferred symbols and indicators. Note : This indicat
Average Sentiment Indicator for MT4 is a composite oscillator that combines the insights of five conventional technical indicators — Relative Strength Index ( RSI ), Stochastic ( STO ), Money Flow Index ( MFI ), DeMarker ( DeM ), and William's %R ( WPR ) — into a single line ranging from 0 to 100. It is the arithmetic average of the five indicators after normalization. This tool is ideal for traders who want a noise-reduced perspective of overbought and oversold zones, potential

Auto Price Squeeze Levels The Auto Price Squeeze Levels indicator is designed to help traders easily and automatically identify and track "Price Compression" (or Price Squeeze) conditions on their charts. Price compression refers to periods where market volatility decreases, and price movements become increasingly confined within a narrow range. This often serves as a significant signal indicating the accumulation of energy before a major price movement (Breakout) is likely to occur in the near

Ultimate Daily SR Zones + Rejection Arrows Ultimate Daily SR Zones is a powerful price-action indicator that helps traders clearly identify the most important daily market levels — the previous day’s High , Low , Midline , and opening/closing reference points.
It also detects wick rejection signals and plots automatic Buy and Sell arrows when the market rejects these zones. This tool is perfect for intraday and swing traders who use daily levels for breakout, reversal, or retest strategies. Wh

Автор: Александр Лапин
---
Описание:
Kinetic Trend — уникальный индикатор, основанный на математической модели затухания кинетической энергии цены. Он строит три независимые инерционные линии (основную, реверсную и зеркальную), а также отображает адаптивные зоны отклонения и их пересечения.
Индикатор не использует стандартные индикаторы, такие как Moving Average или RSI, и предлагает абсолютно новый способ визуализации тренда и силы движения.
---
️ Что делает индикатор:
Три инерц

Auto Buy/Sell with MA Cross for MT4 – Your Smart Trade Assistant! Take the guesswork out of trading with this powerful Moving Average crossover indicator for MetaTrader 4 .
It automatically identifies Buy and Sell opportunities using fast and slow MA crossovers – and shows clear visual signals on your chart. Whether you're a beginner or pro, this tool brings precision, clarity, and confidence to your trading strategy. Key Features: Auto Buy/Sell Signals based on MA crossover Up & Down
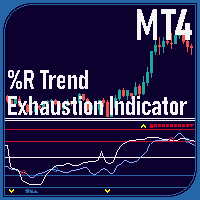
Overview The %R Trend Exhaustion Indicator is a powerful technical analysis tool adapted from TradingView for MetaTrader 4. It helps traders identify trend exhaustion points, potential reversals, and trend continuation signals across various market conditions. With multiple display modes, customizable settings, and enhanced features, this indicator is suitable for diverse trading strategies.
If you want to see more high-quality products or order the development/conversion of your own products,

Double Fractal Entry generates precise entry signals based on smart fractal breakouts or rebounds. It visualizes market structure with dynamic channels and plots clear SL/TP levels. A powerful tool for trend and reversal traders. This product is also available for MetaTrader 5 => https://www.mql5.com/en/market/product/143601 The indicator generates entry points based on two configurable strategies: Fractal Breakout – when price breaks the last key fractal; Fractal Rebound – when price bounces
Professional Tick Volume Indicator with Strength & Absorption Detection Enhance your trading strategy with the TickVolumeMedian indicator for MetaTrader 4, designed to analyze tick volume dynamics with precision. This advanced tool helps identify strong buying/selling pressure, absorption patterns, and volume-based market structure shifts. Key Features: Visual Strength Detection – Distinguishes between strong and absorbed moves using histogram colors.
Smart Volume Classificati

Professional Cumulative Delta & Volume Median Indicator Track real buying/selling pressure with this powerful volume analysis tool. The Volume Compare Indicator combines Cumulative Delta and Volume Medians to help you identify institutional activity, imbalances, and potential reversals. Key Features: Cumulative Delta Histogram – Visualizes net buying vs. selling volume in real-time.
Buy/Sell Volume Medians – Horizontal lines showing average buy & sell volume levels.
Smart Vo

The Color Change MA is a versatile custom indicator designed for MetaTrader 4, providing clear visual signals on trend direction and momentum. It features a Moving Average (MA) line that intelligently changes color based on the MA's position relative to the current candle's open and close prices, with an optional but powerful RSI (Relative Strength Index) filter for enhanced confirmation. Key Features: Dynamic Color-Changing MA: Green: Indicates a bullish bias. By default, this occurs when the M

SniperScope — Indicator for Precise Market Entry SniperScope is an indicator for the MetaTrader 4 platform, designed to accurately determine the right moment to enter the market. The signal filtering system combines two RSI and two MA, effectively eliminating market noise and providing reliable non-repainting signals. Attention! Contact me immediately after purchase to receive setup instructions! Advantages Arrows are fixed once they appear and never disappear Dual filtering with RSI and MA Aler
Oscillator Alerts MultiPanel All oscillator signals — in a single panel!
A professional multi-panel tool for market control, based on major oscillators with a flexible alert system and unique interactive management features. Description Oscillator Alerts MultiPanel is an innovative tool for traders that brings together multi-symbol and multi-timeframe analysis, flexible notifications, and the most convenient interactive control — all right on your chart. Key Advantages Interactive Oscillator Se

# Quantum Apex Meter - Professional Currency Strength Analyzer MT4 ## Demo Version Not working Properly , Quantum Apex Meter 100% Work Real Market Data Only. ### Never Trade Against the Trend Again Are you tired of: Entering trades just before a currency reverses? Missing clear strength/weakness patterns? Wasting hours analyzing multiple charts? The Quantum Apex Meter gives you INSTANT visual clarity on which currencies are strong and weak - across 28 major pairs and 4 timeframes. https://www.

PLEASE REVIEW THE ATTACHED IMAGE CAREFULLY BEFORE READING FURTHER This indicator is designed for MetaTrader 4 (MT4) and focuses on a dual-band envelope system to help traders identify liquidity zones and extreme price levels with clarity and precision. If you purchase this indicator, please contact me via email with your payment receipt attached. I will provide you with a detailed user guide and trading strategy for effective application. I. DUAL ENVELOPE INDICATOR FOR MT4 A simplified yet power
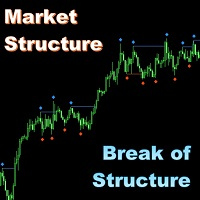
Market Structure - Break of Structure (MS-BOS) for MT4 Added simple dashboard in the right center of the chart - indicating direction of last cancelled BOS level for main set of Timeframes. This panel can be switched off in parameters All my indicators work only at closed bars, they do not repaint any values (if it is not otherwise mentioned in the description). So that they are fully compatible with autotrading, and are ready for making qualitative technical analysis. Market Structure - Brea
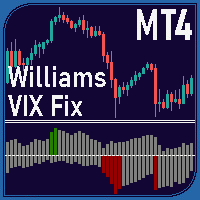
Overview The Williams VIX Fix Indicator is a MetaTrader 4 tool designed to help traders identify potential market tops and bottoms. By analyzing price extremes relative to recent highs and lows, it highlights overbought and oversold conditions using two histograms displayed in a separate window. The indicator combines the Williams VIX Fix calculation with Bollinger Bands and percentile-based thresholds to provide clear signals for potential reversals. Key Features Market Tops and Bottoms Market

MurreyGannQuantum - Professional Trading Indicator Advanced Murrey Math & Gann Angle Technical Analysis with Complete EA Integration Professional technical indicator combining Murrey Math level analysis with Gann angle calculations. Features comprehensive visual analysis, multi-timeframe adaptation, and complete EA integration capabilities for automated trading systems. The blog: https://www.mql5.com/en/blogs/post/763757
CORE FEATURES Technical Implementation: Murrey Math Levels: 9 dynamic su

The Volli v9 indicator is based on the analysis of zones built on volumes. That is, it is based on the analysis of how the price behaves near/in these zones, whether it rebounds, moves further, or does not react. The indicator also displays the aggregate strength of currencies, recommended stops, trend direction, volume trend and their changes.
Also there is EA. https://www.mql5.com/en/market/product/145026?source=Site +Profile
Description 1) The arrows. Drawn on the current candle. On the

Raccoon FP This MQL4 indicator is designed to provide reliable and clear trend signals without unnecessary visual clutter. It detects both trend reversals and strong directional moves by combining advanced filtering logic based on ADX, SAR, and market structure analysis. Key Features: Clean visual signals via arrows (Buy/Sell). Customizable parameters: main period, ADX period, minimum bars, alert options (sound, email, SMS). Multi-timeframe and multi-symbol compatible. Lightweight and profession
DhanSutraX is a fully operational trading system that accurately shows entry and exit points on the chart without redrawing - just follow BUY and SELL signals!
Every trader should use this indicator because it is a fully operational trading system that: accurately indicates where to open and close trades - right on the chart with visual cues. does not redraw - signals remain unchanged after they appear. filters market noise using the slope of the standard deviation channel + SAR, reducing the
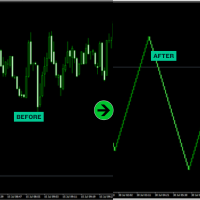
This indicator builds ultra-smooth Renko bricks directly from the 1-minute timeframe, giving scalpers a clean and reliable price structure without noise or lag. It’s designed for real-time trading , where timing and clarity are key. Each Renko brick reflects live market data, ensuring that every shift in price action is visible and tradable.
How It Works:
This Renko engine runs off live M1 price ticks , meaning your chart reflects true momentum and structure not lagging, aggregated price bars.
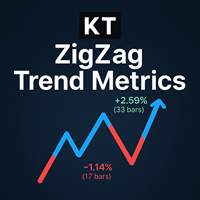
The KT ZigZag Trend Metrics turns market swings into a clear, easy to read map of trend and structure, so even beginners can spot turning points and market flow at a glance. The indicator labels each swing as a Higher High, Lower High, Lower Low or Higher Low and shows the percentage move from the previous swing. It also displays how many bars it took to form the new swing high or low. It also plots lines between each recent swing high and low, giving you an x-ray view of price action that makes

Overview Harmonic Patterns MT4 is a technical analysis indicator designed for the MetaTrader 5 platform. It identifies and displays harmonic price patterns, such as Butterfly, Cypher, Crab, Bat, Shark, and Gartley, in both bullish and bearish directions. The indicator calculates key price levels, including entry, stop loss, and three take-profit levels, to assist traders in analyzing market movements. Visual elements and customizable alerts enhance usability on the chart. Features Detects six ha

Purpose : The AllAverages indicator plots a moving average line on the chart, with options to select from a wide range of MA types and price applications. It also displays buy and sell signals as arrows when the trend changes, and supports alerts (sound, email, push notifications) for these signals. Key Features : Supports multiple moving average types (e.g., SMA, EMA, HMA, TEMA, etc.). Allows customization of the price type (e.g., Close, Open, High, Low, Heiken Ashi variants). Displays a colore

Momentum Hunter – Advanced Non-Repainting Momentum Indicator Momentum Hunter is a powerful and reliable indicator designed to detect fresh momentum and help traders capture market moves with precision. Specially optimized for the M1 timeframe , it also works seamlessly on higher timeframe's, making it suitable for scalpers and swing traders alike. MT5 version of this indicator is available here : https://www.mql5.com/en/market/product/144628 Key Features: Non-Repainting & Non-Lagging : Signals a
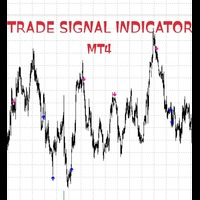
BUY & SELL ARROW INDICATOR MT4 - Professional Trading Signals! CRYSTAL CLEAR TRADING SIGNALS WITH PRECISION ACCURACY. WORKS ON ALL TIME FRAME, BEST ON 1HR TIME FRAME WHAT MAKES THIS INDICATOR REVOLUTIONARY? NO REPAINTING - NO GUESSWORK - NO REGRETS! 100% ACCURATE SIGNALS that never change or disappear ZERO OFFSET - Signals appear exactly when they should PERFECT PRECISION - Best O INSTANT VISUAL CLARITY CRYSTAL CLEAR BLUE ARROWS for BUY signals STRIKING PINK ARROWS for SELL signals CLEAN
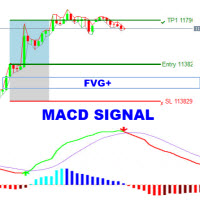
The MACD-FVG Signal System is a hybrid trading indicator that combines the power of momentum analysis through the MACD (Moving Average Convergence Divergence) with the precision of Fair Value Gap (FVG) detection to generate high-probability buy and sell signals. This indicator enhances traditional MACD signals by validating momentum shifts with market inefficiencies, offering traders a more refined entry strategy. Key Features: MACD with Histogram Display
Clearly visualizes the MAC
Do you know why the MetaTrader Market is the best place to sell trading strategies and technical indicators? No need for advertising or software protection, no payment troubles. Everything is provided in the MetaTrader Market.
You are missing trading opportunities:
- Free trading apps
- Over 8,000 signals for copying
- Economic news for exploring financial markets
Registration
Log in
If you do not have an account, please register
Allow the use of cookies to log in to the MQL5.com website.
Please enable the necessary setting in your browser, otherwise you will not be able to log in.