Watch the Market tutorial videos on YouTube
How to buy а trading robot or an indicator
Run your EA on
virtual hosting
virtual hosting
Test аn indicator/trading robot before buying
Want to earn in the Market?
How to present a product for a sell-through
Technical Indicators for MetaTrader 4 - 151
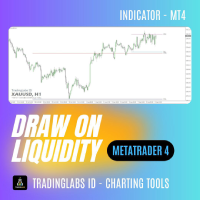
Draw On Liquidity (DOL) – PDHL, PWHL & Kill Zones Liquidity levels often act as magnets for price movement. The highs and lows of the previous day (PDHL) and week (PWHL) are key reference points where stop orders and institutional activity tend to cluster. Identifying these levels manually is time-consuming and prone to error. The Draw On Liquidity (DOL) indicator automatically plots these essential levels on your chart and highlights high-probability trading windows through session kill zones.
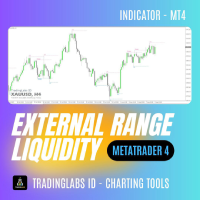
External Range Liquidity - Market Structure Mapper Objectively reading market structure is the foundation of any successful trading strategy. However, manually identifying Swing Highs/Lows, Higher Highs (HH), or Lower Lows (LL) is often subjective and confusing, especially for developing traders. The External Range Liquidity indicator is your complete solution. This tool automatically detects and labels these crucial market structure points directly on your MT4 chart. It provides you with a clea

Mirror Dominance
Назначение: визуально сравнить силу двух валютных пар и ловить моменты смены доминирования. Индикатор строит в отдельном окне две зеркальные линии для выбранных пар, показывает их схождение/расхождение и даёт сигналы на пересечениях (маркеры на основном графике). Есть Alert и Push-уведомления (по желанию), а также мини-метка виртуальной прибыли последнего сигнала.
Автор: Alexander Lapin | Платформа: MT4 Входные параметры (основные)
Pair1 / Pair2 — выбор двух валютных пар из

BONUS INDICATOR HERE : https://linktr.ee/ARFXTools
Trading Flow Using Fibo Eminence Signal 1️⃣ Wait for the Fibonacci to Auto-Draw The system automatically detects swings (from high to low or vice versa) Once the Fibonacci levels appear, the indicator sends an alert notification “Fibonacci detected! Zone is ready.” 2️⃣ Check the Entry Zone Look at the ENTRY LINE (blue zone) This is the recommended SELL entry area (if the Fibonacci is drawn from top to bottom) Wait for the price to enter

Nirvana Trend — Trend indicator with multi‑timeframe confirmation and risk‑management helpers Introduction
Nirvana Trend is an analytical indicator that helps structure trading decisions by delivering filtered signals, multi‑timeframe confirmation, and automatic stop/exit levels based on volatility (ATR). If you operate in environments with constraints such as daily/overall drawdown limits, this tool can support adherence to your personal rules and risk‑management framework. Use cases Structure

Risk Management and Limit Monitoring Indicator for Professional Traders and Evaluation Accounts (Prop) This tool only displays precise risk management and limit information on the chart to help you make more focused decisions. The indicator does not open/close/modify trades and does not interfere with Expert Advisors (EAs). Features Monitoring daily and total drawdown Calculates and displays daily and total drawdown based on Balance or Equity (configurable). Shows the remaining percentage to th
- How It Works Core Concept This is a range breakout trading indicator that identifies consolidation periods (ranges) and generates signals when price breaks above or below those ranges. It can operate in both trending and mean reversion modes. Key Components: 1. Range Identification Range Period : Defines a specific time window each trading day (e.g., 10:00 AM - 12:00 PM) Range Calculation : During this period, the indicator tracks the highest high and lowest low prices Trading Days : Configura

Smart, color-coded moving average with pro-grade smoothing, clean alerts, and multi-timeframe power—built for everyday traders.
## What it does (in plain English) - Draws one moving‑average line on your chart. - The line changes color by direction: - Blue = rising trend - Red = falling trend - Yellow = flat/neutral - Sends alerts when the line flips direction (optional). - Works on your current timeframe or can “borrow” a higher timeframe for extra clarity.
## Why tr

The Donchian Trend Alert is a technical analysis filter designed to objectively measure trend strength, market bias, and reversal signals using the principles of Donchian Channel breakouts . This indicator monitors price action relative to a user defined period channel (default: 10 bars), generating visual arrows and real-time alerts when significant breakout confirmations or trend shifts occur. By providing clear, non-repainting signals , it helps traders validate entr
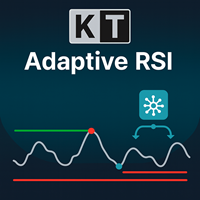
The KT Adaptive RSI indicator integrates a adaptive module with the classic RSI, identifying dynamic overbought and oversold levels based on current market conditions. Traditional RSI assumes an instrument is overbought above 70 and oversold below 30, but this isn't always accurate for every instrument. Our adaptive module quickly analyzes historical data to adaptively identify optimal overbought and oversold thresholds. This helps traders make precise entry and exit decisions tailored to real-

Easy RSI Divergences – Unlock Professional-Level Divergence Trading Easy RSI Divergences is a cutting-edge indicator for MetaTrader 4, crafted for traders who want to gain a competitive edge by accurately identifying RSI (Relative Strength Index) divergences in real time. Whether you are a beginner or a professional, this tool transforms complex market signals into clear, actionable insights. The indicator automatically detects both classic divergences (indicating potential trend reversals) a

"Dynamic Scalping Oscillator" - is an advanced custom Crypto_Forex indicator - efficient Trading tool for MT4!
- New generation of Oscillators - see pictures to check how to use it. - Dynamic Scalping Oscillator has adaptive Oversold/Overbought zones. - Oscillator is an auxiliary tool to find exact entry points from dynamic OverSold/OverBought areas. - Oversold values: below Green line, Overbought values: over Orange line . - This indicator is great to combine with Price Action patterns as we
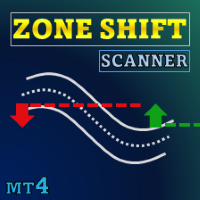
Special offer : ALL TOOLS , just $35 each! New tools will be $30 for the first week or the first 3 purchases ! Trading Tools Channel on MQL5 : Join my MQL5 channel to update the latest news from me Zone Shift is a trend identification tool that uses EMA/HMA-based bands to detect trend shifts and display key reaction levels. It shows trend direction via candle colors and marks important retests with visual cues to help users track momentum. See more MT5 version at: Zone Shift MT5 S

Input: Range Start Time : The starting time of the range creation Range End Time : The ending time of range creation Trade End Time : The time where the line of range zone high/low will be extended to Minimum Size : The minimum size of the range in point Maximum Size : The maximum size of the range in point If the range size is between the minimum and maximum, indicator will print the 1st color (blue).

This indicator is designed for scalping on low timeframes (M1-M15) in volatile markets like major forex pairs (e.g., EURUSD, GBPUSD). It generates non-repainting buy (green up arrow) and sell (red down arrow) signals based on EMA crossover confirmed by RSI momentum and MACD crossovers, minimizing false signals in ranging markets. How to Use:
Attach the indicator to your MT4 chart. Look for arrows on the chart: Buy on green up arrow, Sell on red down arrow. Signals appear at the open of the new
Product Description: Buy Sell Arrow Indicator for MT4
Elevate your trading to new heights with the Buy Sell Arrow Indicator for MT4 , a cutting-edge tool crafted to pinpoint high-probability trading opportunities based on advanced candlestick patterns. Tailored for forex traders, especially those targeting GOLD on the 5-minute chart, this MT4 indicator delivers exceptional accuracy with an impressive 85% win rate , empowering you to seize profitable trades with unwavering confidence.
Key Fea

Scalping Magic Cube is a new generation multi-level intelligent tool designed to accurately determine the direction of market movement and identify potential trend change points. The indicator is based on a complex analysis system that combines elements of linear regression, adaptive moving averages, dynamic filters and impulse strength assessment models. Unlike classical methods that react to the price with a delay, Scalping Magic Cube forms stable trend zones and displays them as color rectan

BONUS INDICATOR HERE : https://linktr.ee/ARFXTools
BBMA Fibo Musang Alert Trend Scanner Smart Indicator Powered by 3 Proven Trading Systems – All in One! Take your trading to the next level with this intelligent indicator that combines three of the most powerful and time-tested strategies in the market: BBMA Oma Ally – Your main reference for trend direction & market mapping
Fibo Musang CBR – Automatically alerts you on key breakout opportunities
Multi Trend Scanner – Fully custom
ALL IN ONE INDICATOR :
Auto Multi Trend : 3 EMA FMCBR-W ( Trend Is Your Friend ) Auto Fibo CBR : Breakout Confirmation Auto Smart Money Area : Download Here https://linktr.ee/ARFXTools
FMCBR-W Multi Trend Scanner + Alert A Smart Indicator Combining 3 Proven Trading Systems — in One Powerful Tool! Boost your analysis accuracy and speed with this intelligent indicator that integrates three popular and effective trading strategies: Core Components: FMCBR-W – Serves as the main gui

The Donchian Gradient transforms classic channel analysis into an intuitive trend tracking system . It plots dynamic color shifting Donchian channels directly on your price chart, visually signaling trend strength and market bias shifts through real time color transitions. This auto adapting price channel adjusts its boundaries and hues to confirm emerging trends, spot potential reversals, and highlight breakout opportunities as they develop. The color coded visualization s
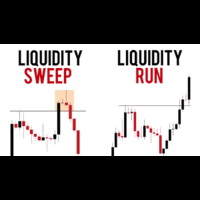
The Liquidity Trap reversal indicator hunts the Liquidity sweeps and when there is quick reversal after the stop hunts it catches it nicely and quickly. A liquidity trap in trading typically refers to a price zone where a large number of orders (especially stop-losses and pending orders) are concentrated . Liquidity Trap → Stop Hunt → Quick Reversal Price consolidates near a key level (e.g., support). Liquidity builds below this level (stop-losses, breakout orders). A sudden sharp move (stop

ALL IN ONE INDICATOR :
Auto Multi Trend : BBMA OMA ALLY_MTF ( Trend Is Your Friend )
Auto Arrow : CSAK & CSM Confirmation
Auto Smart Money Area : Download Here https://linktr.ee/ARFXTools
Trading System: BBMA MultiTrend CSAK/CSM Arrow + Trend Confirmation in the Same Direction
Objective: To find reentry buy/sell opportunities after the appearance of the CSAK/CSM arrow signal, with confirmation of the trend direction aligned (multi-timeframe trend) according to the BBMA Oma Ally con

Any indicator that’s calculated on past bars inevitably “lags” behind current price. Zerolag Pro c alculates on 0 (current) bar using Bid / Ask or Close[0] and lets you “preview” possible signal shifts without waiting for bar close.
Zerolag Pro trading indicator engineered to capture market shifts as they happen. By blending adaptive moving averages, volatility‑based tuning, and momentum confirmation, it delivers cleaner, faster signals without the drag of traditional tools — helping traders a

Designed for precision-minded traders, GannVision fuses time-tested geometric forecasting with modern analytics to deliver unparalleled market insights. Harnessing the power of Gann angles, time cycles, and price harmonics, this tool helps traders identify high-probability entry and exit points, forecast trend reversals, and decode the hidden structure of market movements. Key Features: Gann Angle Mapping for trend strength and direction Time Cycle Forecasting to anticipate turning points

Elevate your breakout trading with the Support Resistance Breakout Indicator MT4, a powerful ZigZag-driven tool that dynamically identifies support and resistance zones, delivering confirmed breakout signals for high-probability entries in forex, stocks, crypto, and commodities markets. Drawing from established price action principles outlined on sites like Investopedia and BabyPips, where breakouts from support/resistance are hailed for signaling trend reversals or continuations by shifting buy

ALL IN ONE INDICATOR :
Auto Multi Trend : BBMA_MTF ( Trend Is Your Friend )
Auto Engulfing Arrow : Candle to Candle
Auto Fibo CBR : Breakout Confirmation Download Here https://linktr.ee/ARFXTools
Auto Smart Money Area : Download Here https://linktr.ee/ARFXTools
BBMA Arrow MACD Trend Strategy (High-Probability Reentry) ️ Core Concept: A fusion of BBMA (Bollinger Bands + MAs) , CSAK/CSM Arrows , and MACD to spot high-probability trend reentry setups , validated across multiple time

How SilverSentintel indicator empowers the silver trader: Regime-aware: differentiates trend vs range so you don’t trade breakouts in chop or fade strong trends blindly. Action gating: only prints arrows when confidence is high and false-probability is low. Risk framing: immediate ATR-based SL/TP suggestions for disciplined execution. Mean-reversion context: intraday VWAP tells you when price is stretched. Silver Sentinel indicator (MQL4, XAG-only, 30m focus) This indicator is engineered for

The TPX Dash Needle is everything you need to find the famous Didi Needles on several timeframes and in several pairs at the same time. These are the simultaneous meeting of the 3, 8 and 20 averages that, aligned with the ADX indicator, are synonymous with large and strong movements in the market. Now with the new Heiken Aish filter, the name of the pair shows the direction of the Heiken Aish you choose, it can be weekly or daily, all signals will appear on the screen, but now you can configure
What is Bias Finder The Bias Finder (with Export) is an advanced indicator designed to detect and analyze market statistical biases, providing a clear visualization of recurring tendencies. This tool is especially useful for both discretionary and systematic traders who want to integrate quantitative analysis into their trading strategies. Analysis Modes The indicator calculates and displays price bias according to different time logics: Hourly Bias : statistical analysis hour by hour. Weekday B

SuperTrend new formula – advanced SuperTrend indicator for accurate market analysis
SuperTrend new formula is an enhanced version of the popular SuperTrend indicator, designed to meet the needs of modern traders. Unlike classical solutions, this tool combines local extremum analysis, dynamic levels, and adaptive algorithms, delivering a cleaner and more structured view of market phases. The SuperTrend new formula plots two dynamic lines — upper and lower — that visually separate bullish and be
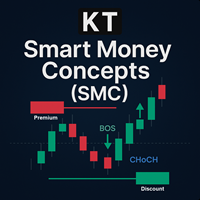
KT SMC indicator scans every bar in real time and marks key Smart Money Concepts elements such as break of structure, change of character, order blocks, fair-value gaps, discount/premium zones, equal highs/lows and more, popularised by ICT and used by price-action traders worldwide. It gives clear, on-chart visuals that help even newer traders read market flow with confidence.
Smart Money Concepts focuses on spotting where large players leave buy-side or sell-side liquidity. By tracking those

IntraScalpermt4 Indicator is an advanced, dynamic level-providing strategy built on proven price action principles.
At the start of every trading session, it automatically calculates the decisive Golden Level —a key point that guides high-probability trade opportunities. The upper blue line signals a confirmed short move towards the dotted lines, while the same logic applies to downside trends. Each dotted line is drawn once per day and represents a 90% likelihood of reversal based o
Pair correlation divergence. Define your pair in indicator setting with this format : SYMBOL1:SYMBOL2,SYMBOL3:SYMBOL4 Already Defined Symbols : EURUSD:GBPUSD,AUDUSD:NZDUSD,USDCHF:EURUSD,USDCAD:Crude,XAUUSD:AUDUSD Symbol name should match the exact case as you see it in left panel where all symbols are listed. (Indicator will not work on strategy tester, strategy tester fail to load different symbols data internally, watch video for functional usage) CAUTION : If you drag any symbol on screen
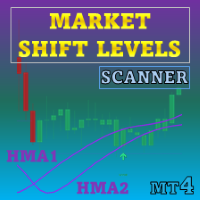
Special offer : ALL TOOLS , just $35 each! New tools will be $30 for the first week or the first 3 purchases ! Trading Tools Channel on MQL5 : Join my MQL5 channel to update the latest news from me This indicator identifies trend shifts and visualizes market-structure turning points using Hull Moving Average (HMA) logic. It highlights potential areas of support and resistance where price may react, helping users observe early trend transitions. See more MT5 version at: Market Shif

IQ6kPower — Market Intelligence Redefined IQ6kPower is not just another technical indicator.
It’s the distilled essence of adaptive trading logic, refined to operate at what we call an effective market IQ of 6000 . This isn’t a marketing flourish — it’s a statement of precision, adaptability, and insight at a scale few tools can match. Proven Performance:
IQ6kPower has been battle‑tested in live market conditions and rigorous simulated environments — including successfully navigating multiple
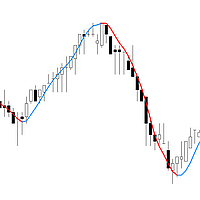
Flash Trend - т рендовый индикатор, напоминающий скользящую среднюю, но с адаптивной формулой, которая позволяет выявлять смену тренда гораздо быстрее, чем стандартные скользящие средние.
Особенности: Индикатор разработан для трейдеров ориентированных на трендовую торговлю и помогает оперативно выявлять смену тренда на любом таймфрейме. Для большей эффективности, можно применить на графике вторую линию с периодом в 5-10 раз больше первого, получив таким образом линию тренда старшего таймфрейма

You Trade with "The Trend is your Friend!" Attitude?
This is your Indicator... Golden Trend Alert Pro Tired of having MT4 and TradingView open because you can't get your trendline alerts?
You don't want to miss your trade anymore?
With the Golden Trend Alert Pro you will definitely never miss the trend in your direction again. You simply install the indicator in the terminal and then draw your trend lines.
The trend lines must be labeled "Alarm_up_..." or "Alarm_down..." Alarm_up, you will s
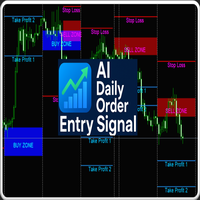
H1 indicator with daily BUY/SELL zones, Stop Loss, and two Take Profit levels. Includes HUD (spread, timeframe, countdown). No popups, no DLLs. AI Daily Order Entry Signal — H1 Only
This MT4 indicator draws clear daily BUY and SELL zones directly on your H1 chart. Each zone includes predefined Stop Loss, Take Profit 1, and Take Profit 2 levels, giving you a complete daily trade plan without extra setup.
How to Use - Attach to any H1 chart (works with forex, crypto, indices, metals). - Follow

Purpose :
This indicator displays real-time risk and target profit exposure of your open/pending trades directly on the chart, with optional multi-currency conversion (e.g., USD → INR or any currency pair you enter). Main Features Risk Tracking Calculates the total risk exposure if Stop Loss (SL) is hit. Expressed in Account Currency (e.g., USD) plus optional conversions. Target Profit Tracking Sums up potential profit to Take Profit (TP) (only for orders where TP is set). Useful for comparin
## RSI Divergence Printer Indicator This MetaTrader 4 (MT4) non repainting indicator automatically identifies and prints RSI divergences directly onto your price chart. This indicator can be used at any timeframes and is suitable for scalping, daytrading and swingtrading. In short, it looks for moments when the price is moving in one direction, but the underlying momentum is moving in the opposite direction, signaling a potential trend reversal. ## Explanation of the Indicator This tool, the
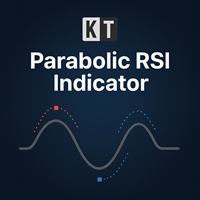
KT Parabolic RSI overlays Parabolic SAR directly on the RSI line to highlight likely market turning points. Classic RSI overbought and oversold readings already hint at reversals, but the added PSAR filter removes much of the noise and sharpens those signals, giving you clearer and more reliable trade setups. Big Square Signals: A Parabolic SAR flip on an RSI that sits in overbought or oversold territory. These mark high-probability market turns. Small Square Signals: A SAR flip inside the neutr
The Adaptative Moving Average Zeiierman is a technical analysis tool designed to identify trading opportunities through adaptive trend analysis. This Metatrader adaptation of Zeiierman's original TradingView indicator which combines several analytical methods to provide visual market assessments.
Technical Features Utilizes an adaptive smoothing algorithm based on market volatility Calculates an Efficiency Ratio (ER) to adjust sensitivity dynamically Incorporates Sigma bands for volatility meas

Pro Trend Sniper is a powerful trading indicator designed for traders who demand accuracy and speed in spotting market opportunities. With advanced trend detection, it helps you identify clear entry and exit points , giving you the edge to stay ahead in the markets. Its clean design and easy-to-use interface make it perfect for both beginners and professionals, ensuring you trade with confidence and precision . With three profit targets (TP1, TP2, TP3) clearly displayed, you can secure profits s
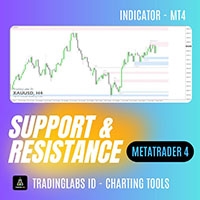
Classic Support & Resistance Tired of drawing support and resistance levels manually?
Now you can save time and trade with confidence using the Classic Support & Resistance Indicator. This tool automatically plots key support and resistance zones on your MT4 chart with high accuracy and clean visualization. Designed especially for traders who rely on Breakout – Retest Entry strategies and market structure analysis. Key Features: Auto Support & Resistance Zones
Automatically identifies and plots

Magical Arrow Indicator – Clear & Reliable Signals The Magical Arrow Indicator is a non-repainting, trend-following tool that gives you crystal-clear Buy and Sell signals .
It high-probability reversals and entries . No more guesswork – just follow the arrows on your chart! The Magical Arrow Indicator is a powerful, easy-to-use trading tool that helps you catch the most profitable Buy and Sell opportunities in the Forex market.
It is designed for beginners and professional traders , giving y
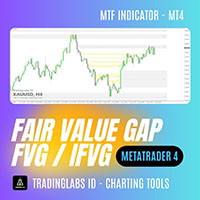
Fair Value Gap (FVG) & Inversion Fair Value Gap (iFVG) – TradingLabs ID In the ICT (Inner Circle Trader) concept, a Fair Value Gap (FVG), also known as Imbalance, occurs when price moves too quickly, leaving behind a gap without sufficient order balance. These areas are highly valuable for professional traders as they often signal potential retracement or entry zones with high probability. The FVG & iFVG Indicator is designed to automatically detect Fresh, Mitigated, and Inversion Fair Value Gap

Trend Pulse One is a new generation indicator based on an improved version of Parabolic SAR, supplemented with arrow signals. Its purpose is to simplify the process of trend analysis and provide the trader with clear, visually understandable entry and exit points.
The main difference from the standard SAR is that Trend Pulse supplements the SAR lines with arrows that signal a change in trend direction. This makes the indicator convenient for visual analysis and application in real trading.
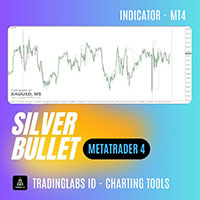
ICT Silver Bullet – Time Window Indicator The ICT Silver Bullet indicator automatically marks the ICT Silver Bullet time windows on your chart, helping you stay focused on the highest-probability setups defined by the ICT methodology. This tool is especially powerful when combined with a Fair Value Gap (FVG) indicator – simply wait for an FVG setup to form inside the Silver Bullet window, and you’ll have a precise time-based confirmation for your entries. Key Features: Automatic Silver Bullet Wi
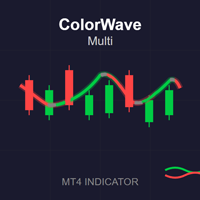
ColorWave Multi MA The ColorWave Multi MA is a highly configurable Moving Average (MA) indicator, with some advanced features: 1. Purpose of the indicator It draws a moving average line on the chart.
Instead of a single color, it splits the MA into three line segments :
Up (green) when the MA is rising,
Down (red) when the MA is falling,
Flat (gray, dotted) when the MA is flat within a threshold.
It supports many MA types , not just the standard SMA/EMA.
This is useful for traders b

Trend Catcher for MT4 – Your Advanced Ally in Precision Trading Trend Catcher for MT4 is an innovative indicator designed to provide traders with advanced tools for financial market analysis, combining precision, reliability, and ease of use. Based on sophisticated algorithms, this indicator interprets price movements and market volatility to generate clear and timely signals, ideal for identifying trend beginnings, potential reversals, and strategic entry or exit points. One of Trend Catcher fo
The Donchian Time Sync Analyzer brings powerful multi-timeframe dimension to classic Donchian channel analysis, allowing traders to simultaneously monitor trend strength and potential reversal signals across five different chart periods. This advanced indicator calculates the highest highs and lowest lows across your selected timeframes, generating clear visual signals that help identify convergence of trend direction across multiple time horizons. By providing coordinated an

Indicator Description GOLD TITAN KING SIGNAL INDICATOR High-Precision Gold Scalping Buy/Sell Signals – Manual Trading Assistant Overview The Gold Titan King Signal Indicator is a manual trading assistant tool designed for high-frequency scalping on Gold (XAUUSD) and other major pairs.
It generates clear BUY/SELL signals with precise entry levels, along with adjustable Stop Loss and Take Profit levels displayed directly on the chart. ️ This tool is NOT an EA. It does not execute trades

Williams' Market Dynamics Compass: Ваш навигатор в хаосе рынка! Устали от множества индикаторов и запутанных графиков? Williams' Market Dynamics Compass — это комплексный инструмент, который объединяет классические и проверенные временем стратегии Билла Уильямса в одном удобном решении. Индикатор поможет вам видеть рынок как единую, динамичную систему, а не набор случайных движений. Что внутри?
Мультитаймфреймовый анализ AO (Awesome Oscillator): Получайте информацию о трендах на разных таймфре
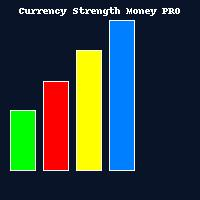
Description in English Currency Strength Money PRO — The Ultimate Currency Strength Indicator The Currency Strength Money PRO was designed for traders who need clarity and accuracy when analyzing Forex and Metals markets. ️ Modern LiveCharts-style display — colored bars instantly show which currencies are strong and which are weak.
️ Fully customizable — select currencies, timeframes, weights, and colors to fit your strategy.
️ Smart alerts — get notifications when a true imbalance between
What is this Indicator?
The Volume Power Meter is a lightweight MT4 indicator that measures the strength of trading volume and converts it into an easy-to-read rating between 1/10 and 10/10 .
Instead of showing complex histograms or volume bars, it gives traders a simple numeric score in one corner of the chart: 1/10 = Very weak volume 5/10 = Average volume 10/10 = Extremely high volume This helps traders quickly judge market participation and momentum without cluttering th

NeoPrescience AI: The Ultimate All-in-One Trading Dashboard & Scanner Main Dashboard on a clean chart. A Buy/Sell signal with TP/SL projection zones. Scanner Panel showing multiple high-confidence setups. A non-Forex chart (e.g., XAUUSD or BTCUSD) to highlight versatility.
Stop Guessing. Start Trading with Data-Driven Confidence. Cluttered charts. Dozens of conflicting indicators. Missed opportunities. NeoPrescience AI changes everything.
This is not just another indicator — it is your complet
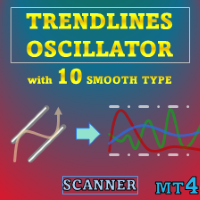
Special offer : ALL TOOLS , just $35 each! New tools will be $30 for the first week or the first 3 purchases ! Trading Tools Channel on MQL5 : Join my MQL5 channel to update the latest news from me Trendlines Oscillator identifies trend and momentum using normalized distances between the current price and the most recently detected bullish (support) and bearish (resistance) trend lines.
See more MT5 version at: Trendlines Oscillator MT5 Scanner See more MT4 version at: Trendline
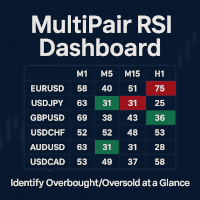
MultiPair RSI Dashboard MultiPair RSI Dashboard is a powerful indicator that scans multiple symbols across multiple timeframes and displays live RSI values in a clear table format. No more switching charts or timeframes – get the full RSI picture of the market at a glance! Key Features Multi-Pair Monitoring – Track RSI levels for any list of currency pairs, indices, metals, or crypto. Multi-Timeframe View – From M1 to D1, instantly see RSI conditions side by side. Overbought/Oversold Alerts
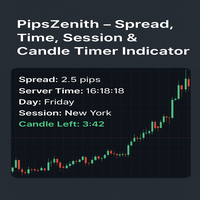
PipsZenith – Spread, Time, Session & Candle Timer Indicator (v3.2) Description:
Stay one step ahead in Forex trading with PipsZenith , the ultimate on-chart tool that gives you everything you need at a glance. Designed for precision traders, this indicator displays: Real-time Spread – Know the exact cost of your trades instantly. Server Time – Always stay synchronized with broker time. Day & Weekday Info – Track your trading week effortlessly. Active Trading Session – Instantly identify Tokyo,
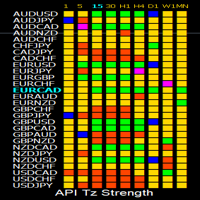
API Tz Strength Indicator MT4 – All-in-One Strength Dashboard for 28 Symbols and 9 Timeframes Take your Strength analysis to the next level with one powerful dashboard. The API Tz Strength Indicator MT4 is designed for traders who want to track market strength and reversals across multiple symbols and timeframes – all from a single chart. With advanced clickable controls, customizable watchlists, and smart alerts, this tool simplifies multi-symbol, multi-timeframe analysis like never before. ___

Candlestick Momentum is a professional-grade technical analysis indicator that identifies high-momentum candlesticks using advanced ATR (Average True Range) analysis. This indicator helps traders identify potential trend continuation or reversal points by detecting candles with strong directional movement and minimal wicks.
Trading Strategies
Strategy 1: Momentum Breakout - Setup : Wait for momentum candle signals - Entry : Enter on arrow signal - Stop Loss : Below/above the momentum candle -
Take full control of your trading time. BarCounter solves one of the biggest challenges in intraday trading: the accuracy of bar counting. This smart and lightweight indicator automatically counts every candle formed since the day's opening, allowing you to monitor the session's progress with total confidence. It is essential for those who need strict time tracking, as it turns uncertainty into clarity and manual counting into an automated operation.
Advanced SRP (Strong Retracement/Reversal Points) Tired of support and resistance indicators that constantly repaint, clutter your charts with irrelevant lines, and fail across different timeframes? It's time to stop guessing and start trading with institutional-grade clarity. Advanced SRP is not just another S/R tool; it's a definitive market structure indicator designed for the serious trader. It identifies and displays the most critical price levels where the market is statistically likely t
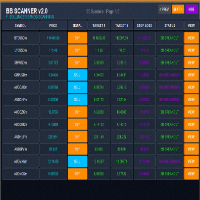
BB Scanner MT4 is a powerful, next-generation market scanner that detects Bollinger Bands breakouts across multiple symbols and timeframes.
It provides a modern, interactive dashboard that displays signals, entry price, target levels, stop loss, and real-time status — all in one place. Key Features Multi-Symbol & Multi-Timeframe Scanning (auto or custom list) Precise BB Breakout Detection (Buy/Sell with ATR-based targets) Automatic Target 1, Target 2, Stop Loss calculation ️ Modern
Multi-Line Alert with Buffer & Push Notifications (MT4 Indicator) Originally shared as a free community tool , this upgraded version is now available on the MQL Market for traders who want professional-grade alerts without sitting in front of the screen all day. With this indicator, simply place horizontal lines on your chart — the indicator will automatically track them, highlight your chosen buffer zone, and notify you the moment price approaches your level. Whether you’re trading support/r

Technically, the indicator represents the difference between two fractal adaptive moving averages. Fractal Adaptive Moving Average (FraMA) is a smart adaptive moving average developed by John Ehlers. FraMA takes price changes into account and closely follows the price level, remaining straight during price fluctuations. FraMA takes advantage of the fact that markets are fractal and dynamically adjusts the lookback period based on this fractal geometry. The indicator has the ability to send notif

The Donchian Breakout Scanner Pro is a comprehensive multi-symbol monitoring tool that automatically tracks Donchian channel breakouts across various trading instruments and timeframes. This advanced scanner continuously analyzes price action using the classic Donchian channel methodology , identifying significant breakout patterns as they develop across your selected portfolio of symbols. The system presents these trading opportunities through an intuitive color-coded button int

Session Kill zones with panel for quick changes.
Asia Killzone London Killzone New York Killzone London Close Killzone In this indicator GMT+2 timings are used that are most common among many brokers. read the image attached in the screenshots to know more about sessions adjustments Session timings can be changed according to your broker timings and day light savings.
Thank you :) Always open to feedback and criticism if it helps me provide you more value. - Rahul My other indicators you may l
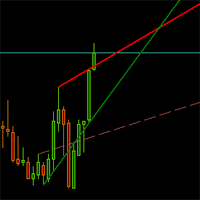
Dynamically draws trend lines, broken trend line. Auto delete after X minutes or Y hours. Enter the # of bars look back period. Lines re-draw at the close of each new bar ensuring the current trend is followed.Inputs include support line color, resistance line color, width, style (solid, dotted, dashed). Watch demo video here: https://www.youtube.com/watch?v=N1Bf82bsqws

Quantum Arrow is a powerful Non-Repainting indicator specifically designed for the XAUUSD M15 timeframe, though it works effectively on any symbol and any timeframe. The indicator includes many useful features such as alerts, popups, and push notifications, offering flexibility for traders to adjust its values according to their preferences. Its price is highly affordable compared to the value and quality of the signals it provides. For any questions or support, please feel free to contact. Than
MetaTrader Market - trading robots and technical indicators for traders are available right in your trading terminal.
The MQL5.community payment system is available to all registered users of the MQL5.com site for transactions on MetaTrader Services. You can deposit and withdraw money using WebMoney, PayPal or a bank card.
You are missing trading opportunities:
- Free trading apps
- Over 8,000 signals for copying
- Economic news for exploring financial markets
Registration
Log in
If you do not have an account, please register
Allow the use of cookies to log in to the MQL5.com website.
Please enable the necessary setting in your browser, otherwise you will not be able to log in.