 MetaTrader 5
 Experts
 Indicators
 Libraries
 Utilities
 Widgets
 Rules
Watch the Market tutorial videos on YouTube
How to buy а trading robot or an indicator
Run your EA on
virtual hosting
virtual hosting
Test аn indicator/trading robot before buying
Want to earn in the Market?
How to present a product for a sell-through
Technical Indicators for MetaTrader 4 - 157
 Signals from technical indicators listed below play a crucial role in opening and closing deals in MetaTrader 4 platform.
The essence of indicators is a mathematical transformation of a financial symbol price aimed at forecasting price changes.

Fibo AUTO Pro: Redefining Fibonacci Analysis - Smarter, More Intuitive, More Efficient Product Overview
Fibo AUTO Pro is a professional-level technical analysis indicator designed specifically for modern traders. Based on the classic Fibonacci retracement theory, it has been comprehensively enhanced with intelligence to address the pain points of traditional drawing tools in terms of efficiency, visualization, and accuracy. Fibo AUTO Pro is not merely a line-drawing tool; it is your intellige

Institutional Liquidity Compression Indicator This indicator measures real-time liquidity tightening using the normalized width of Bollinger Bands, trading volume, and average spread to identify compression phases preceding price breakouts. Display:
Professional-style separate window with a histogram showing the “Compression Score” and a threshold line. Key Features Early Detection: Identifies contraction zones before major price impulses. Multi-Factor Measurement: Combines normalized Bollinger
Mean Reversion Probability – Statistical Reversal Indicator Short Description
Institutional-grade indicator that calculates the statistical probability of a mean reversion toward the 200-period moving average, based on historical overextension analysis. Identifies market fatigue zones with quantitative precision. Main Features
Advanced Statistical Analysis – Builds a database of 500+ historical extensions to compute real probabilities
Probability Score (0–99%) – Quantifies the exact likelihood
WBP Chart Signals – Multi-TimeFrame Buy/Sell Pressure Indicator Description:
WBP Chart Signals is an advanced indicator that measures market pressure by analyzing volume, spread, and price action. Ideal for traders seeking precise signals with multi-timeframe confirmation and institutional-style analysis. Key Features: Weighted Buy Pressure (WBP): Proprietary algorithm combining VWAP, MA200, volume strength, liquidity factors, and momentum Multi-TimeFrame Analysis: Automatic higher timeframe co

ARB is an indicator designed to identify high-probability breakout opportunities through an adaptive ATR channel system and a precise multi-factor scoring model (0–100).
It combines volatility, volume, momentum, and multi-timeframe trend analysis to deliver filtered, visual, and actionable signals in real time. OPERATING PRINCIPLES The indicator is based on the concept of Adaptive Range Breakout (ARB) — a modern breakout trading approach that automatically adjusts its thresholds according to mar

MA Ribbon PRO – Dynamic Trend Map with Real-Time Direction & Strength (MT4) See the trend instantly!
MA Ribbon PRO shows live direction (Long / Short) and strength (Weak / Medium / Strong) with color-coded precision.
A compact info panel updates on every tick – fast, clear, and intuitive. Why traders love it Real-Time Direction: Instantly displays Long / Short based on current price vs. the main MA. Readable Momentum: “Strength” measures ribbon expansion or contraction over time. Clean Visua

Hi Traders,
On purchase this tool we will give lifetime free updates for this tool
you can contact me how to use this tool better or your suggestion for improvement
This tool will work on any accounts
Where When Enter Exit – Trade Plotter helps traders easily see, track, and review their sell trades directly on the chart.
It clearly shows where you entered, when you exited, and why , so you can quickly learn from every trade. Key Features Auto Plot Entries & Exits

PinBar Dashboard Pro - Multifunctional Pattern Scanner Overview PinBar Dashboard Pro is a professional tool for traders that provides real-time scanning of 4 key price patterns on 6 timeframes for a variety of trading instruments. It is an ideal solution for quick market analysis and finding trading opportunities.
Key Features Multifunctional Scanning 4 Patterns: PinBar, Engulfing, Doji, InsideBar
6 timeframes: M30, H1, H4, D1, W1, MN1
Unlimited number of symbols (up to 64 instrument

Crypto_Forex Indicator "Stochastic with Alerts" for MT4, No Repaint. - Stochastic oscillator is one of the best indicators on the market - perfect tool for many traders. - With built-in PC and Mobile Alerts for both: Entry to OverSold/OverBought zones and Exit from OverSold/OverBought zones. - With built-in PC and Mobile Alerts for Stochastic and Signal line cross. - With adjustable trigger levels for Alerts activation. - OverBought zone - is above 80; OverSold zone - is below 20. - Indicator c

The proposed indicator is based on the method of William D. Gann (1878-1955), which uses the relationship between price and time. In this method, the relationship is expressed as follows: Price = Time squared or P = t ² This relationship between price and time can be represented graphically. To do this, a significant Low and a significant High are taken from the chart. A parabola is then constructed using the “Parabolic_Gann” indicator. Next, a new parabola is constructed from the base that ap
RET System Channel Indicator
1 of 10 indicators used in the RET System to achieve Reversal Anticipation Purpose : Dynamic support/resistance zones. Visual : Envelope bands adapting to price volatility. Use : Identify overbought/oversold levels and project reaction zones.
RET System Channel Strengths : Detects choppy/range-bound zones Confirms trade setups Identifies high-probability setups (outside bands) Acts as a profit target tool Defines short-term currency price ranges Weaknesses :
We have always believed that the most efficient and intuitive methods can bring good results. M1 Breaking Point: An Intuitive Trading Indicator System
M1 Breaking Point is an exceptionally intuitive trading indicator system, meticulously engineered for the M1 timeframe. It functions seamlessly as a standalone system for scalping or minor trend trading on fast-moving one-minute charts, and also integrates effortlessly into your existing trading strategy to enhance decision-making efficiency.
Wh
Banks Session Lines Indicator The Banks Session Lines automatically highlight times of the day the price moves.
It helps smart money traders to clearly mark and track the key institutional trading sessions the banks operate in — Asian, London, and New York with fully customizable session lines for your charts.
Designed for traders who need clarity and precision when tracking volatility cycles.
Why Banks Session Lines? Because every major move begins and ends within institutional banks trading
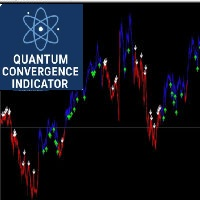
Strategy Overview The Quantum Convergence Indicator is an advanced multi-dimensional trading system that identifies high-probability entry points by analyzing the convergence of multiple market dimensions. This sophisticated algorithm detects when price action, momentum, and volatility align to create optimal trading opportunities. Key Features Multi-Dimensional Analysis Trend Dimension : Analyzes market direction using dual momentum oscillators Momentum Dimension : Measures market strength and
RET System High Low Indicator The RET System High Low indicator is 2 of 10 indicators part of the Reversal Edge Trading Suite , built to help traders identify exhaustion zones, reaction levels, and reversal points with precision.
It maps the market’s structural extremes —the key highs and lows where momentum often fades or reverses—allowing you to anticipate shifts before they happen. By combining level-to-level logic with trend awareness, this tool helps traders avoid chasing price and inste
Looking for a trading tool based on the CCI indicator that can display crossovers arrows on all time frames? Introducing trading indicator : All Time Frame Double CCI Model T ready to help you achieve daily profits. This tool is created using the intersection of two CCI (Double CCI) indicator lines: the main CCI and the signal CCI. Using this tool makes it easier to observe the real-time dashboard and intersections of multiple timeframes simultaneously. Viewing both higher and lower timeframes
RET Momentum is 3 of 10 indicators designed to help traders identify the acceleration phase of market moves — where reversals turn into trends and trends begin to exhaust.
It forms part of the RET System , working in sync with the RET Channel , High Low , and Exhaustion indicators to confirm R eversal Anticipation setups and avoid premature entries. This tool measures real-time momentum flow through proprietary candle calculations, color shifts, and smooth transitions — making it easier t
Looking for a trading tool based on the CCI indicator that can display crossovers arrows on all time frames? Introducing trading indicator : All Time Frame Double CCI Model S ready to help you achieve daily profits. This tool is created using the intersection of two CCI (Double CCI) indicator lines: the main CCI and the signal CCI. Using this tool makes it easier to observe the real-time dashboard and intersections of multiple timeframes simultaneously. Viewing both higher and lower timeframes
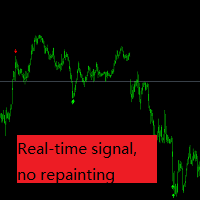
Based on over 10 years of trading experience, we have compiled technical indicators and real-time signals that are suitable for gold trading in various cycles without redrawing. However, we need to set parameters. The default parameter now is one minute cycle gold trading, and the signal is very reliable, with 3 to 5 signals per day. Of course, you can also adjust the parameters to find the one that suits you. After thorough research, we can achieve 100% stable profit. Wishing everyone a prospe
Signal Histogram is a reliable technical indicator for the MetaTrader 4 platform designed to visually identify the current trend by comparing the closing price with a moving average. The indicator displays the histogram in a separate window: green bars indicate that the price is above the average, while red bars indicate that the price is below or equal to the average. This approach allows you to quickly assess the trend direction and identify potential reversal points. The indicator generates
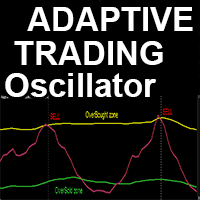
Advanced custom Crypto_Forex indicator "Adaptive Trading Oscillator" - efficient auxiliary Trading tool for MT4! - This indicator is a New generation of Oscillators - see pictures to check how to use it. - "Adaptive Trading Oscillator" has adjustable adaptive Oversold/Overbought zones. - This oscillator is an auxiliary tool to find exact trade entry points on the Exits from dynamic OverSold/OverBought areas. - Oversold zone: below the Green line. - Overbought zone: above Yellow line . - This i
RET System Fast Bias The RET Fast Bias indicator is number 4 of 10 tools in the RET System , revealing when short-term momentum begins to shift against or with the dominant trend.
It helps traders identify the first signs of bias change — when short-term energy confirms, opposes, or precedes the larger market move. Built around Reversal Anticipation , Fast Bias is designed to show when price action is about to change direction before it does. What It Does Displays short-term market bias di
Trend Flow Entry Pro is a simple yet powerful trend-following indicator designed to help you enter the market at optimal pullback points.
The system displays an Entry Signal at the top-right corner of the chart.
When both indicators are blue, a Buy signal is triggered — ideal for long entries.
When both are red, it signals a Sell opportunity — perfect for short trades.
These signals appear only when the market is trending clearly, helping you ride the wave with confidence and avoid sideways
The Reflection Angle indicator is a high-precision professional tool that delivers over 90% accuracy across all timeframes . It’s designed to detect price reversals and pinpoint ideal entry points with exceptional reliability. Key Features: Works flawlessly on all timeframes with no signal delays. Performs best during high-liquidity sessions such as London and New York . Ideal for news events and volatile market conditions . Proven signal accuracy exceeding 90% in real trading tests. Recom

Buy Sell Arrow Swing MT4
Limited-Time Offer! Get It Now for Just $121 (Regular Price: $199) – Save $78! Clear Market Structure. Reliable Swing Signals. Buy Sell Arrow Swing MT4 is designed to help traders identify key market swing points and understand trend structure with clarity. It provides clean Buy and Sell signals based on confirmed market movements, making it easier to follow price action across any timeframe or instrument. The indicator focuses on simplicity and stability, allowing tra

Toukou Indicator – Your Winning Edge for Gold and Forex Trading The Toukou Indicator is a powerful trading tool designed to maximize profits in Gold (XAUUSD) and the Forex market .
Built on advanced algorithmic logic, it accurately identifies ideal entry and exit zones , adapting dynamically to changing market conditions. ️ Key Features: Smart Trend Detection: Instantly identifies bullish and bearish market phases. Accurate Buy & Sell Signals: Generated only under the most favorable tr

Indicator Name: BreakingConfirmedLevel
Type: Professional indicator for detecting confirmed breakouts of strong price levels Description:
The BreakingConfirmedLevel indicator is an advanced tool designed to detect confirmed breakouts of strong price levels in the market. It relies on precise price action analysis and multi-layer confirmation logic before generating any signal. This ensures highly accurate entry points after a real breakout, minimizing false signals and increasing consistency in
Looking for a trading tool based on the MACD indicator that can display crossovers arrows on all time frames? Introducing trading indicator : All Time Frame MACD Model T ready to help you achieve daily profits. This tool is created using the intersection of two indicator lines of MACD : the main MACD and the signal MACD. Using this tool makes it easier to observe the real-time dashboard and intersections of multiple timeframes simultaneously. Viewing both higher and lower timeframes simultaneou

Looking for a trading tool based on the MACD indicator that can display crossovers arrows on all time frames? Introducing trading indicator : All Time Frame MACD Model S ready to help you achieve daily profits. This tool is created using the intersection of two indicator lines of MACD : the main MACD and the signal MACD. Using this tool makes it easier to observe the real-time dashboard and intersections of multiple timeframes simultaneously. Viewing both higher and lower timeframes simultaneou

Looking for a trading tool based on the Stochastic indicator that can display crossovers arrows on all time frames? Introducing trading indicator : All Time Frame Stochastic Model T ready to help you achieve daily profits. This tool is created using the intersection of two indicator lines of Stochastic : the main Stochastic and the signal Stochastic . Using this tool makes it easier to observe the real-time dashboard and intersections of multiple timeframes simultaneously. Viewing both higher

Looking for a trading tool based on the Stochastic indicator that can display crossovers arrows on all time frames? Introducing trading indicator : All Time Frame Stochastic Model S ready to help you achieve daily profits. This tool is created using the intersection of two indicator lines of Stochastic : the main Stochastic and the signal Stochastic . Using this tool makes it easier to observe the real-time dashboard and intersections of multiple timeframes simultaneously. Viewing both higher

Double Edge Forex Indicator — User Manual “Master both sides of the market with precision and clarity.” ️ Introduction Welcome to the Double Edge Forex Indicator — your trading companion designed to simplify market analysis and amplify trading confidence. This tool empowers traders to visualize trend strength , direction , and reversal zones across multiple timeframes — all from one elegant chart panel. Whether you’re a scalper , swing trader , or day trader , Double Edge helps you identify

This system is very useful for trading because it solves several classic problems: Objectivity & Precision Benefit: It eliminates the trader's personal bias. Every trader might draw a trendline slightly differently, but this indicator uses a precise mathematical logic (Fractals) to find the pivot points. The resulting lines are objective and consistent every time. Dynamic Updates Benefit: Your chart is always current. As soon as a new pivot is confirmed, the new trendline is drawn automatically

Track your daily profit and loss in real time. Displays current account performance, peak gain, and drawdown directly on the chart. Simple, lightweight, and compatible with all symbols. Daily Trade Monitor — Real-Time Daily P&L Tracker for MetaTrader 4 Monitor your trading performance with precision. Daily Trade Monitor is a lightweight, visual indicator that displays your current account profit or loss and captures the maximum profit and loss of the day, indicating the exact time and minute eac
Looking for a trading tool based on the RSI indicator that can display crossovers arrows on all time frames? Introducing trading indicator : All Time Frame Double RSI Model T ready to help you achieve daily profits. This tool is created using the intersection of two RSI (Double RSI) indicator lines: the main RSI and the signal RSI. Using this tool makes it easier to observe the real-time dashboard and intersections of multiple timeframes simultaneously. Viewing both higher and lower timeframes
Looking for a trading tool based on the RSI indicator that can display crossovers arrows on all time frames? Introducing trading indicator : All Time Frame Double RSI Model S ready to help you achieve daily profits. This tool is created using the intersection of two RSI (Double RSI) indicator lines: the main RSI and the signal RSI. Using this tool makes it easier to observe the real-time dashboard and intersections of multiple timeframes simultaneously. Viewing both higher and lower timeframes

Goldman Balanced PRO, is an Indicator that has merges EMA trend structure, Stochastic Oscillation, RSI Momentum and ATR volatility zones into a single visual indicator. This produces clean zones and show possible areas of bulls and bears supported by confidence meter and retracement filters. this will give an overview of how the market is currently structured.
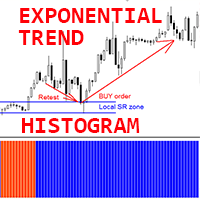
Crypto_Forex Indicator "Exponential Trend Histogram" for MT4, No Repaint. - Exponential Trend Histogram indicator is very efficient for trend detection purpose. - The best way to use it - is to combine with Support/Resistance Levels and Retest technique (see pictures): - Once indicator detects new trend - find local SR level and arrange corresponding pending order there expecting Retest of that zone. - If new trend is bullish - arrange Buy Limit pending order; if new trend is bearish- arrange S
Looking for a trading tool based on the moving average indicator that can display crossovers arrows on all time frames? Introducing trading indicator : All Time Frame Two MA Model T ready to help you achieve daily profits. This tool is created using the intersection of two moving average indicator lines: the main MA1 and the signal MA2. Using this tool makes it easier to observe the real-time dashboard and intersections of multiple timeframes simultaneously. Viewing both higher and lower timef

Looking for a trading tool based on the moving average indicator that can display crossovers arrows on all time frames? Introducing trading indicator : All Time Frame Two MA Model S ready to help you achieve daily profits. This tool is created using the intersection of two moving average indicator lines: the main MA1 and the signal MA2. Using this tool makes it easier to observe the real-time dashboard and intersections of multiple timeframes simultaneously. Viewing both higher and lower timefr
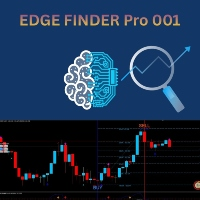
Edge Finder Pro 001 i s your all-in-one visual trading assistant, designed to cut through the market noise and highlight high-probability trading opportunities at a glance. It is an enhanced version with profit-taking levels, improved chart visibility, and greater ease in entering and exiting the market . How It Works (The Core Idea): Instead of overloading your chart with complex numbers, Edge Finder Pro 0 0 1 uses a unique, color-coded system to paint the market picture clearly. Trend & M

Sweeper PRO – Advanced Candle Sweep Detector (3-in-1) For any questions, technical issues, or support requests, feel free to contact us through any of the following channels: WhatsApp Support: Contact1 Email:
Money.transporter@gmail.com Overview Sweeper PRO is a powerful and fully customizable indicator designed to detect three unique types of candle sweeps — smart entry and reversal patterns commonly used by professional price action traders.
It automatically identifies potential f
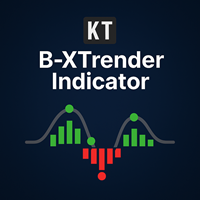
Read Short and Long Trend Momentum Together KT B Xtrender places two coordinated momentum histograms in a separate indicator window. The short-term view reacts to the difference between two exponential moving averages, while the long-term view follows the direction of a separate exponential moving average. Both calculations are centered around zero so immediate movement can be compared with the broader trend state. Understand the Chart Signals The display separates momentum state from changes in
Quick Draw Panels lets you instantly draw custom present trading objects (zones and trendlines) instantly with one click from the panel fixed neatly in any chart corner. This is the mt4 version of the product. No more searching through toolbars or menus one click, one object, done. Fully customizable colors, line size, and style.
Ideal For: Institutional / Smart Money Concept (SMC) / Supply and Demand traders. Supply and Demand zone marking. Technical Analysis marking. Liquidity and ICT Order

The Pips Stalker is a long short arrow type indicator, the indicator helps traders of all levels to take better decisions trading the market,the indicator never repaints and uses RSI as main signal logic, once an arrow is given it will never repaint or back paint and arrows are not delayed. MAIN GOLD SET FILE <----Click to see. MT5 Version <---- FEATURES OF THE PIPS STALKER ARROW : STATS PANEL a unique info dashboard that shows overall win rate % and useful stats such as max win and lost trades

Trade Session Marker is an advanced Session marker Designed for professional traders seeking clarity, accuracy, and smart session label. this gives clear session start and ending. that will enable user to make decision on what to do in the session. It marks all session start and close, for clarity 15M timeframe gives a clear marker. this will boost planning for entry and exit of trades, it also allow you to see how the market has moved over the session.
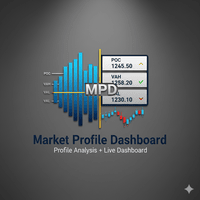
Market Profile with Dashboard Indicator - Complete User Guide xau only
Here our more valuable tools
SMC Trend Trading , Easy SMC Trading , Institutional SMC Architect Volume Analysis Tools , Volume flow Profile , Market volume profile , FVG with Volume , Liquidity Heatmap Profile , Volume Spread Analysis The Market Profile with Dashboard is a comprehensive trading analysis tool for MetaTrader 4 that displays market profile data, volume analysis, and key market structure informa
FVG Detector Pro MT5 – Advanced Fair Value Gap Detection Indicator FVG Detector Pro is a professional Fair Value Gap (FVG) detection indicator for MetaTrader 5, designed to help traders identify potential institutional imbalance zones with speed, accuracy, and chart clarity. The indicator automatically detects Bullish and Bearish Fair Value Gaps across all symbols and timeframes, helping traders analyze possible continuation areas, liquidity imbalances, and price reaction zones often used in pr

Develope Note : Break Out Explosion is contain Free Trade Assistant can do auto trade based on this strategy Symbols: USDCHF, USDJPY , XAUUSD, GBPUSD, EURUSD, AUDUSD, GBPJPY ( I Love USDCHF_H1 ) Timeframes: H1, H4, D1 Important features : No repaint, no lag, indirection signal, multi confirmation Safety : signals contain stop loss , take profit and respect risk to reward rule Includes: Free Multi-Time-Frame Scanner (After purchasing this product, simply send me a screenshot via private me
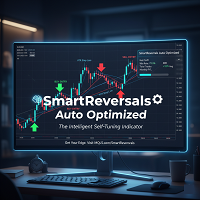
SmartReversals Auto Optimized: The Intelligent Indicator That Adapts to Your Chart Tired of indicators with fixed settings that only work in one market? Frustrated by endless manual optimization with no results? Introducing SmartReversals Auto Optimized – the first indicator that automatically optimizes itself for your chart. The real magic is its built-in Auto-Optimization Engine . Revolutionary Feature: Smart Auto-Optimization No more manual backtesting or guessing parameters! Whe

OB Scanner Indicator — Overview OB Scanner is an enhanced Support & Resistance + Supply & Demand indicator designed to help traders identify where institutions and smart money are placing orders. It scans the chart for: 1. Order Blocks (Improved Demand & Supply Zones) Automatically detects Bullish Order Blocks (Demand) Automatically detects Bearish Order Blocks (Supply) Marks high-probability reversal zones Filters out weak OBs with volume and break-of-structure (BOS) confirmation 2. Buyer
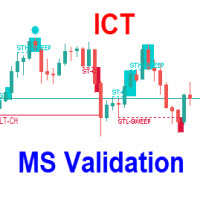
The ICT Anchored Market Structures with Validation trading indicator is designed to bring precision, objectivity, and automation to price action analysis. It helps traders visualize real-time market structure shifts, trend confirmations, and liquidity sweeps across short, intermediate, and long-term market phases — all anchored directly to price, without relying on any external or user-defined inputs. Uses Market structure is one of the most critical foundations of price action trading st

Does this sound familiar? You enter based on an arrow signal, only for the price to immediately reverse and hit your stop loss... You enter on a baseless gut feeling like, "It looks like it's about to go up," only to end up with a floating loss (a classic case of overtrading)... You can see a clear trend is forming, but you don't know where to get in, and you're stuck watching the perfect opportunity slip by... You repeatedly buy at the top and sell at the bottom, watching your capital slowly dw

JED-Trend Enhanced v5.9 — Elite Non-Repainting Trend Filter
JED-Trend Enhanced v5.9 is a professional trend-following indicator based on a three-dimensional analysis of market dynamics: - Jerk — the third derivative of price (acceleration of acceleration) detects emerging momentum - Shannon Entropy — measures market orderliness and filters out chaotic noise - SMA-Based Phase Analysis — structures the market into bullish, bearish, and flat phases
Key Features
Phase-Based Filteri

MFCS (Multi Factor Channel Score) is an advanced indicator designed to provide a clear reading of market dynamics through a weighted scoring system and adaptive volatility-based channels. MAIN FEATURES: Adaptive ATR channels adjusted to real-time volatility Multi-factor scoring (position, volume, momentum, HTF trend, volatility) Signals categorized by score intensity (0–100) Complete dashboard showing score, trend, and key indicators Multi-timeframe filtering to align market direction Optional
Williams Fractal Trailing Stop is a professional trading tool that combines the principles of Bill Williams fractal analysis with an adaptive trailing stop mechanism. The indicator provides an accurate definition of the moments for entering a trade and minimizing market risks.
The system automatically identifies fractal structures on the chart and calculates optimal levels for moving a stop order. This allows you to protect profits and limit losses.
The indicator continuously analyzes marke

Reversing MACD — Indicator Overview Reversing MACD is a forward-looking analytical tool that calculates the exact price the next bar would need to reach for the MACD line and the signal line to cross on the upcoming candle .
Instead of waiting for a crossover to occur after the fact, the indicator answers a more powerful question: “At what price will the MACD cross on the very next bar ?” Core Idea Behind the Indicator Traditional MACD reacts to price changes after they occur .
A trader only see

Imagine: you are on the verge of huge profits, but the market suddenly changes and you miss the chance. Or even worse, you get losses instead of profits. What if you had a reliable ally who whispers in advance: "Get ready – the waves are coming!"? Meet Harbinger , a revolutionary indicator for MetaTrader 4, specially designed for traders who are tired of chaos and want to anticipate market changes! Harbinger is a smart algorithm that analyzes hidden trend volatility patterns to signal upcoming p

Acceleration Bias — Price Acceleration Impulse Indicator Acceleration Bias is a modern analytical tool designed to measure changes in price acceleration and visualize impulse asymmetry using a robust mathematical model.
This indicator is intended for traders working with market volatility, impulse phases, and price-movement structure, as well as those who need algorithmic, rule-based analytical support. Purpose and Core Concept Unlike traditional oscillators that analyze only velocity changes

Dynamic FVG Detector – Fair Value Gap Indicator for MetaTrader 4 Dynamic FVG Detector automatically detects and displays Fair Value Gaps (FVG) on the chart. It identifies three-candle inefficiency patterns and updates zones in real time as they fill. Main Features Automatic detection of bullish and bearish FVGs Configurable pip threshold Minimum three-candle structure Immediate historical validation when a zone is created Dynamic Fill Tracking Continuous adjustment based on price interaction Zon
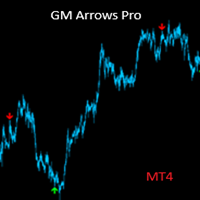
Product Name: GM Arrows Pro – Signals & Alerts Short Description:
GM Arrows Pro is a clean, reliable MT4 indicator showing BUY/SELL arrows on the chart with unique alerts at the moment the signal appears. Full Description:
GM Arrows Pro is a professional MT4 indicator designed for traders who want clear, actionable signals: BUY and SELL arrows visible on the entire chart history Unique alerts when a new signal appears (no repeated alerts) Option to disable repetitive signals ( disable_repeatin
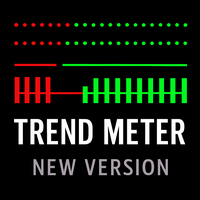
Multi-currency trend analysis indicator for MetaTrader 4 that visualizes trend direction and trend strength across multiple timeframes. For analysis purposes only. TREND METER – MULTI-CURRENCY TREND ANALYSIS INDICATOR (MT4) Trend Meter is a technical trend analysis indicator designed to visualize trend direction, trend strength, and trend alignment across multiple timeframes and symbols. The indicator is intended as a visual analysis tool and does not open trades automatically. Concept Market
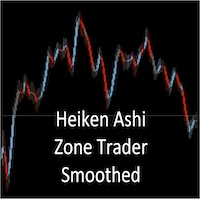
Smoothed Heiken Ashi with AC/AO Zones – Professional Trading Clarity Transform your Heiken Ashi analysis with intelligent smoothing that eliminates noise while preserving actionable signals. What Makes This Different? This isn't just another Heiken Ashi indicator. We've engineered a sophisticated smoothing engine that works with the Accelerator (AC) and Awesome Oscillator (AO) zone logic to give you cleaner entries and exits without sacrificing responsiveness. Four Smoothing Methods at Your Comm
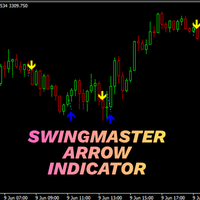
SwingMaster Arrow Indicator Catch Clean Swings • Stay Aligned with the Trend SwingMaster Arrow Indicator is a swing-based trading tool designed to identify potential market turning points and highlight structured Buy and Sell opportunities. It combines volatility-aware trend logic with price structure analysis to detect meaningful swing reversals while filtering out market noise. The indicator displays clear Buy (up arrow) and Sell (down arrow) signals directly on the chart, helping traders foc

IMPORTANT NOTE : This is a dashboard indicator and will not work on strategy tester.
Multi-Symbol Trend Scanner - Professional Market Analysis Tool Overview The Multi-Symbol Trend Scanner is a sophisticated trading dashboard that provides real-time market analysis across multiple financial instruments simultaneously. Designed for both novice and professional traders, this powerful indicator displays crucial market data in an intuitive, table-aligned format that's easy to interpret at a glan

Smart Risk Manager Pro – Drag & Trade with Confidence
Smart Risk Manager Pro MT5: https://www.mql5.com/en/market/product/155713 Smart Risk Manager Pro is a professional on-chart risk management tool that calculates your position size based on your dollar risk. Simply click and drag on the chart and the indicator instantly shows: Direction (Buy / Sell) Distance in points Recommended Lot Size based on your RiskUSD value The tool is ultra-light, extremely fast, and designed for traders who want a

ConfluencePro — Multi-Factor Algorithmic Confluence Engine ConfluencePro is a professional trading system designed for MetaTrader. It leverages a comprehensive 12-Factor Confluence Engine to filter market noise, identify technical trade setups, and assist in structural market analysis. By combining technical indicators, smart order block zones, structural price action, and multi-timeframe analysis, ConfluencePro provides a clean, unified dashboard designed to simplify your daily market analy
Product Title Smart MA PRO (MT4) – part of the SmartView series Short Description Professional advanced edition of Smart Moving Average with 12 custom MA types, smart alert system, two-color trend line, and integrated SmartView control panel on chart. Combines professional power and high performance with ease of use and smart interface. Overview Smart Moving Average PRO is a comprehensive upgrade from the free version, providing 8 additional advanced moving average types (HMA, KAMA, DEMA, TEMA,
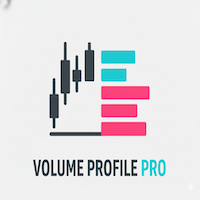
Volume Profile Pro Indicator This indicator is the Volume Profile Pro tool, designed to help analyze "at which price level the most trading activity occurred." It comes with these additional special capabilities: 1. Display Modes Volume Profile (Standard): Shows the Total Volume at each price range to visualize key support and resistance zones. Delta / Money Flow: Shows the "difference" between Buy and Sell pressure ( Buy vs Sell ) to indicate who controls the market at that price. You can choos
Product Title Smart ZigZag Pro (MT4) – part of the SmartView Indicators series Short Description The professional edition of the ZigZag indicator with an on-chart Smart Control Panel, advanced analytical tools, dynamic support/resistance levels, automatic trading signals, pattern recognition, wave statistics, and comprehensive customization for all elements. The Free version shares the SmartView Panel feature with the Pro version. Overview Smart ZigZag Pro is the professional edition of the Smar
The MetaTrader Market is the best place to sell trading robots and technical indicators.
You only need to develop an application for the MetaTrader platform with an attractive design and a good description. We will explain you how to publish your product on the Market to offer it to millions of MetaTrader users.

You are missing trading opportunities:
- Free trading apps
- Over 8,000 signals for copying
- Economic news for exploring financial markets
Registration
Log in
You agree to website policy and terms of use
If you do not have an account, please register