Something Interesting - page 33
You are missing trading opportunities:
- Free trading apps
- Over 8,000 signals for copying
- Economic news for exploring financial markets
Registration
Log in
You agree to website policy and terms of use
If you do not have an account, please register
There is interesting EA which was created for MT5:
-------------
CodeBase:
Bullish and Bearish Engulfing - expert for MetaTrader 5
This EA (the latest fixed version) is trading on 'Bullish and Bearish Engulfing' patterns.
The development thread (free development) - Requests & Ideas (MQL5 only!)
There is interesting EA which was created for MT5:
-------------
CodeBase:
Bullish and Bearish Engulfing - expert for MetaTrader 5
This EA (the latest fixed version) is trading on 'Bullish and Bearish Engulfing' patterns.
The development thread (free development) - Requests & Ideas (MQL5 only!)
And everything with images:
Hurst exponent
The article
Calculating the Hurst exponent
The CodeBase (for MT5)
Variations of the Hurst Exponent over time
The book
Mastering Hurst Cycle Analysis: A modern treatment of Hurst's original system of financial market analysis
Interesting article presenting trading strategy on Donchian Channel with 3 confirmation strategy.
https://www.mql5.com/en/articles/3146
This script PivotPointToHTML https://www.mql5.com/en/code/1357 easy to check daily pivot points level for any instrument.
Stochastic
The beginning
After
============
Trader Styles: Technical vs Fundamental, Short-Term vs Long-Term and Discretionary vs Automated (based on the article)
Technical vs. FundamentalTechnical analysisis the art of studying past price behavior and attempting to anticipate price moves in the future. These are traders that focus solely on price charts and often times incorporate indicators and tools to assist them. They look at price action, support and resistance levels, and chart patterns to create trading strategies that hopefully will turn a profit.
Fundamental analysis looks at the underlying economic conditions of each currency. Traders will turn to the Economic Calendar and Central Bank Announcements. They attempt to predict where price might be headed based on interest rates,jobless claims, treasury yields and more. This can be done by looking at patterns in past economic news releases or by understanding a country’s economic situation.
Short-Term vs. Medium-Term vs. Long-TermDeciding what time frame we should use is mostly decided by how much time you have to devote to the market on a day-to-day basis. The more time you have each day to trade, the smaller the time frame you could trade, but the choice is ultimately yours.
Short-Term tradinggenerally means placing trades with the intention of closing out the position within the same day, also referred to as
“Day Trading” or “Scalping”if trades are opened and closed very rapidly. Due to the speed at which trades are opened and closed, short-term traders use small time-frame charts (Hourly, 30min, 15min, 5min, 1min).
Medium-Term tradesor “Swing Trades” typically are left open for a few hours up to a few days. Common time frames used for this type of trading are Daily, 4-hour and hourly charts.
Long-Term tradinginvolves keeping trades open for days, weeks, months and possibly years. Weekly and Daily charts are popular choices for long term traders. If you are a part-time trader, it might be suitable to begin by trading long term trades that require less of your time.
Discretionary vs. Automated
Discretionary tradingmeans a trader is opening and closing trades by using their own discretion. They can use any of the trading styles listed above to create a strategy and then implement that strategy by placing each individual trade.
The first challenge is creating a winning strategy to follow, but the second (and possibly more difficult) challenge is diligently following the strategy through thick and thin. The psychology of trading can wreak havoc on an otherwise profitable strategy if you break your own rules during crunch time.
Automated trading or algorithmic tradingrequires the same time and dedication to create a trading strategy as a discretionary trader, but then the trader automates the actual trading process. In other words, computer software opens and closes the trades on its own without needing the trader’s assistance. This has three main benefits. First, it saves the trader quite a bit of time since they no longer have to monitor the market as closely to input trades. Second, it takes the emotions out of trading by letting a computer open and close trades on your behalf. This means you are following your strategy to the letter and are not able to deviate. And third, automated strategies can trade 24 hours a day, 5 days a week giving your account the ability to take advantage of any opportunity that comes its way no matter the time of day.
Forum on trading, automated trading systems and testing trading strategies
Indicators: Levels
Sergey Golubev, 2013.11.13 07:42
How to Trade a Descending Triangle
Talking Points
===============
What is a Descending Triangle pattern?
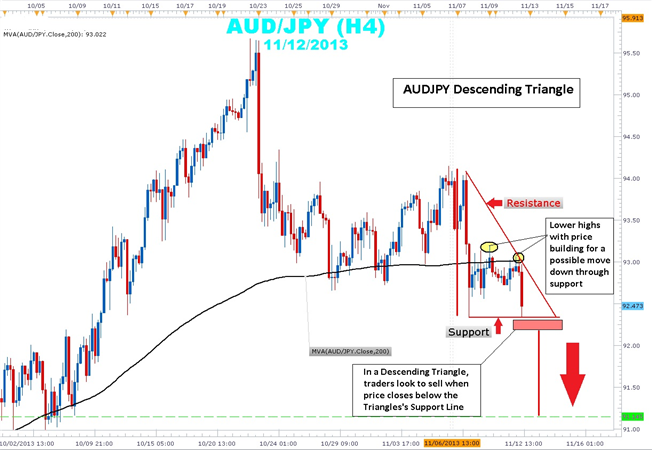
A descending triangle pattern is consolidation price pattern composed of lower swing highs pushed lower by an established downtrend line converging with a horizontal support made up of a series of swing lows located in roughly the same area. Another name for the descending triangle is the right triangle pattern due to its similarity to the geometric shape of the same name. The height of the triangle meets the horizontal support at a 90 degree angle.
Usually, descending triangles form as profit taking by sellers is met with bargain hunting buyers. However, the buying pressure is mutted as higher lows are not made. A news release or economic announcement could be the catalyst required to push price out of this coil tilting the balance strongly in the seller's favor. Unlike its cousins, the symmetrical triangle and ascending triangle, the descending lacks significant bullish participation indicated by that lack of higher lows.
Taking a look at the current AUDJPY 4-hour chart, you can clearly see price action bound between a descending trend line that connects the 11/6 swing high of 94.15 to 11/12 swing high of 93.05. This swing high is a lower swing high than the 11/10 93.19 swing high showing the building strength in the downtrend. Current price action within the triangle is below the 200 simple moving average (SMA), a key indicator that traders use to determine bullishness or bearishness.
Traders will watch price action for a 4-hour candle close below support to confirm that there is follow through in a potential breakout. Stops can be placed near the middle of the triangle just above the 93.00 and 200 SMA. The height of the triangle is a little over 170 pips. By extending this height from the support level of a potential breakout zone, look for a possible target of 91.14. The profit target coincides with the lows seen back on October 2nd.
In summary, descending triangles can be an excellent way to rejoin a downtrend that clearly illustrates risk and reward. Price has a tendency to break form the descending triangle in a downward direction.
Forum on trading, automated trading systems and testing trading strategies
Something Interesting
Sergey Golubev, 2016.02.04 13:10
This is interesting indicator coded for MT4 and for MT5 - Hodrick Prescott:
By the way, one of the coder (who coded and placed his version on CodeBase - see links above) is suggesting to use this indicator for scalping on open bar for M1 timeframe.
Interesting article: Thomas DeMark's Sequential (TD SEQUENTIAL) using artificial intelligence
In this article, I will tell you how to successfully trade by merging a very well-known strategy and a neural network. It will be about the Thomas DeMark's Sequential strategy with the use of an artificial intelligence system. Sequential is well described by DeMark in the book "The New Science of Technical Analysis", which will be useful for reading to any trader. You can find more details on the book here.