Something Interesting - page 27
You are missing trading opportunities:
- Free trading apps
- Over 8,000 signals for copying
- Economic news for exploring financial markets
Registration
Log in
You agree to website policy and terms of use
If you do not have an account, please register
Forum on trading, automated trading systems and testing trading strategies
How to Start with Metatrader 5
Sergey Golubev, 2016.12.13 16:06
Just something which newbie may read for example:
A FEW TIPS FOR FIRST-TIME CUSTOMERS
1. Jobs Service - Why Do We Even Need It?
2. Common Types of Orders
3. The Ideal RS, What Is It Like?
4. A Few Words About Debugging And Testing
5. Describing Detected Errors
6. Hidden Traps in RS
7. When to Resort to Arbitration?
Recommended links
This is very interesing article: WORKING WITH GSM MODEM FROM AN MQL5 EXPERT ADVISOR
Forum on trading, automated trading systems and testing trading strategies
Something Interesting to Read December 2016
Muhammad Syamil Bin Abdullah, 2016.12.14 10:48
Arbitrage: The authoritative guide on how it works, why it works, and how it can work for you : Chris Green
Arbitrage is the practice of taking advantage of a price difference between two or more markets, striking a combination of matching deals that capitalize upon the imbalance, the profit being the difference between the market prices. This is the complete, authoritative, and exhaustive manual outlining the Arbitrage business model. It has been compiled and made available to anyone interested in buying products to be resold online. In this book, Chris Green will give you the keys to the Arbitrage Kingdom with the mindset of unlimited opportunities and abundance and not one of scarcity. Empires are being built by using powerful new programs like ScanPower to source and evaluate items for resale. Pair this with Amazon's amazing fulfillment program called Fulfillment By Amazon (FBA) to outsource the storage, shipping, and customer service of your items, and you have a completely scalable, nearly risk-free business model with a near-zero entry cost. The techniques described in this book can be used by anyone, anywhere to build a small side business or large empire. The only limit is you imagination.
There is very interesting and simple indicator which can be used together many trading systems just to re-enter of the main trade:
Horizontal GridLines - indicator for MetaTrader 5Forum on trading, automated trading systems and testing trading strategies
Press review
Sergey Golubev, 2016.12.21 06:51
Best indicators for the modern trader (based on Futures Magazine article)
1. Moving Averages
"That is because price trends are characterized by a natural progression that is indeed timeless. Market price activity tends to proceed through phases of directional swings followed by taking a rest. The degree of that directional volatility and length of the rest (‘consolidation’) periods can vary widely. However, within the overall trend psychology, the attempted reversal patterns which inevitably form during rest phases are a key to the health of any trend."
2. Balance of Power (BOP)
"Since most of what we do is mechanical trading, and different algos perform well under different market conditions, we have found we can really increase our performance by actively heeding what the market is trying to show. BOP helps tease those messages out."
3. Price Action with a powerful risk management tool
"Before an indicator is used it is essential to understand the limitations of the indicator. In other words, when does it perform well and when does it not perform well. Often times an indicator is used across all markets with the expectation that it will perform equally well in all market environments around the clock."
4. Oil price
"Oil is a fickle beast. Our indicators used to be all about America’s thirst for oil and geopolitics disrupting supply, we’re channeling the band Kansas and have gone past the point of no return. Now when we’re trading WTI it’s all about U.S. production and the pace of economic growth. We used to talk about how a $10 increase in the price of crude oil would decrease GDP by 0.5%"
5. Stock Indices
6. 100-day Moving Average
'"Take the GBP/USD as an example: the pair’s uptrend has stretched to 400 pips from its 100-day MA on four separate occasions this year, and each time (including just two weeks ago) rates have pulled back by 300-400 pips before finding support, presenting a better buying opportunity for trend-following traders."
Forum on trading, automated trading systems and testing trading strategies
correlated CURRENCIES
Sergey Golubev, 2016.09.06 18:00
About the EA (there was a thread about it):
Multi currency EA may be based on some other systems. The only thing to do (except the system itself) is 'account protection feature'. Because those kind of EAs may be risky, and this risk is for whole the account (just my opinion sorry). But it also depends on how it will be coded for example.
============
As to correlation so I found the following :
Video
MT5 CodeBase
Forum on trading, automated trading systems and testing trading strategies
Indicators: MFCS Currency Correlation Chart
Sergey Golubev, 2013.10.26 09:29
Currency Pairs Correlation in Forex Market: Cross Currency Pairs
As a forex trader, if you check several different currency pairs to find the trade setups, you should be aware of the currency pairs correlation, because of two main reasons:
1- You avoid taking the same position with several correlated currency pairs at the same time and so you do not multiply your risk. Additionally, you avoid taking the positions with the currency pairs that move against each other, at the same time. 2- If you know the currency pairs correlations, it may help you to predict the direction and movement of a currency pair, through the signals that you see on the other correlated currency pairs.
Now I explain how currency pairs correlation helps. Lets start with the 4 major currency pairs: EURUSD ; GBPUSD ; USDJPY and USDCHF.
In both of the first two currency pairs (EURUSD and GBPUSD), USD works as the money. As you know, the first currency in currency pairs is known as the commodity and the second one is the money. So when you buy EURUSD, it means you pay USD to buy Euro. In EURUSD and GBPUSD, the currency that works as the money is the same (USD). The commodity of these pairs are both related to two big European economies. These two currencies are highly connected and related to each other and in 99% of the cases they move on the same direction and form the same buy/sell signals. Just recently, because of the economy crisis, they moved a little differently but their main bias is still the same.
What does it mean? It means if EURUSD shows a buy signal, GBPUSD should also show a buy signal with minor differences in the strength and shape of the signal. If you analyze the market and you come to this conclusion that you should go short with EURUSD and at the same time you decided to go long with GBPUSD, it means something is wrong with your analysis and one of your analysis is wrong. So you should not take any position until you see the same signal in both of these pairs. Of course, when these pairs really show two different direction (which rarely happens), it will be a signal to trade EUR-GBP. I will tell you how.
Accordingly, USD-CHF and USDJPY behave so similar but not as similar as EURUSD and GBPUSD, because in USD-CHF and USDJPY, money is different. Swiss Franc and Japanese Yen have some similarities because both of them belong to oil consumer countries but the volume of industrial trades in Japan, makes JPY different.
Generally, when you analyze the four major currency pairs, if you see buy signals in EURUSD and GBPUSD, you should see sell signals in USDJPY. If you also see a sell signal in USD-CHF, then your analysis is more reliable. Otherwise, you have to revise and redo your analysis.
EURUSD, GBPUSD, AUDUSD, NZDUSD, GBPJPY, EURJPY, AUDJPY and NZDJPY usually have the same direction. Just their movement pattern sometimes becomes more similar to each other and sometimes less.
What do I prefer?
If I find a sell signal with EURUSD and GBPUSD and a buy signal with USDJPY, I prefer to take the short position with one of the EURUSD or GBPUSD because downward movements are usually stronger. I will not take the short position with EURUSD or GBPUSD and the long position with USDJPY at the same time, because if any of these positions goes against me, the other one will do the same. So I don’t double my risk by taking two opposite positions with two currency pairs that move against each other.
How to use the currency pairs correlation to predict the direction of the market?
When I have a signal with a pair, but I need confirmation to take the position, I refer to the correlated currency pairs or cross currency pairs and look for the confirmation. For example I see a MACD Divergence in USDCAD four hours chart but there is no close support breakout in USDCAD four hours or one hour chart. I want to take a short position but I just need a confirmation. If I wait for the confirmation, it can become too late and I may miss the chance. I check a correlated currency pair like USDSGD and if I see a support breakout in it, I take the short position with USDCAD. Now the question is why I don’t take the short position with USDSGD and I use its support breakout to go short with USDCAD? I do it because USDCAD movements are stronger and more profitable. I use USDSGD just as an indicator to trade USCAD.
It happens that you take a position with a currency pair, but it doesn’t work properly and you don’t know if it was a good decision or not. On the other hand, you don’t see any sharp signal on that currency pair to help you decide if you want to keep the position or close it. In such cases, you can check a correlated currency pair and look for a continuation or reversal signal. It helps you to decide about the position you have.
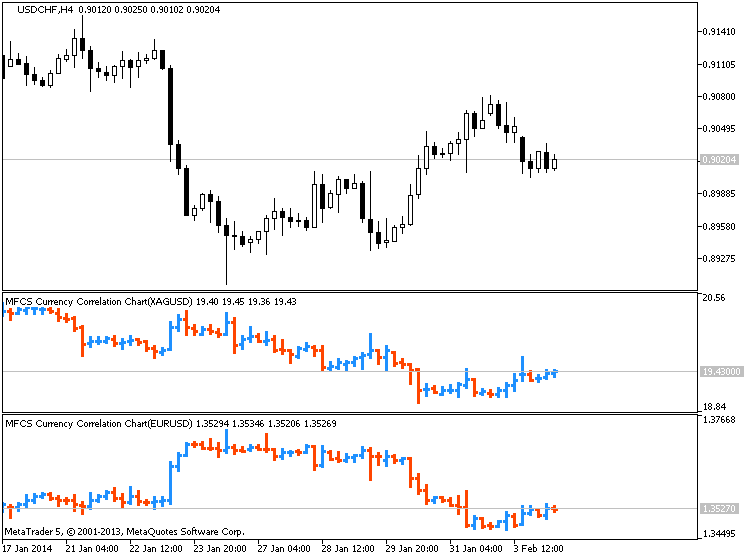
Sometimes, some correlated currency pairs don’t move in the way that they are supposed to move. For example EURUSD and USDJPY go up at the same time, whereas they usually move against each other. It can happen when Euro value goes up and USD value doesn’t have a significant change, but at the same time JPY value goes down, because of some reason. In these cases, you can use the below table to find and trade the currency pair that its movement is intensified by an unusual movement in two other currency pairs. In this example, if EURUSD and USDJPY go up at the same time, EURJPY will go up much stronger (see the below chart).
Or if EURUSD goes up and AUDUSD goes down at the same time, EUR-AUD goes up strongly.
Another important example: If EURUSD goes up and GBPUSD goes down at the same time, EURGBP goes up strongly. Maybe this is the most important case that we can trade based on this rule. It happens many times that EURUSD and GBPUSD move against each other and that is the best time to trade EURGBP. Now you know why EURGBP doesn’t move strongly most of the time. It is because EURUSD and GBPUSD move in the same direction most of the time. For example they go up at the same time and so EURGBP doesn’t show any significant movement because when both of the currencies of a currency pair go up or down at the same time, that currency pair doesn’t show any strong movement and direction (I hope you know why a currency pair goes up or down. It goes up when the first currency value goes up OR the second currency value goes down. For example EURUSD goes up, if Euro value goes up or USD value goes down. If this happens at the same time, then EURUSD goes up much stronger).
The below chart includes almost all of these unusual movements and their results on the third currency pair.
if EURUSD and USDJPY then EURJPY means if EURUSD and USDJPY go up at the same time, then EURJPY goes up much stronger.
Forum on trading, automated trading systems and testing trading strategies
Indicators: MFCS Currency Correlation Chart
Sergey Golubev, 2014.02.04 09:27
Australian Dollar Strongly Correlated to Gold, Silver, Steel Prices (based on this article)
View forex correlations to the SPDR Gold ETF Trust (GLD), United States Oil Fund ETF (USO), SPDR Dow Jones Industrial Average ETF Trust (DIA), UK FTSE 100 Index, and IShares Silver Trust ETF (SLV) prices:
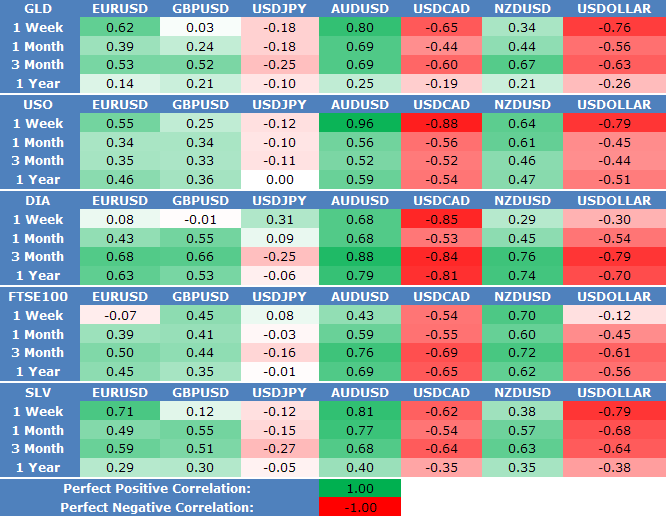
XAUUSD/AUDUSD :
XAGUSD/EURUSD :
XAGUSD/USDCAD :
Forum on trading, automated trading systems and testing trading strategies
Press review
Sergey Golubev, 2016.12.26 10:34
True Leverage (based on the article)
What is Leverage in Forex?Leverage is your total maximum possible borrowing ratio.
What is Margin in Forex?Margin is the minimum cash deposit required by the broker to cover any open trades. It is sometimes expressed as a percentage.
What is Position Size in Forex?"Position size" is the quantity of what is being traded.
Risk of Margin CallA "margin call" is when your broker tells you that you do not have sufficient funds in your account to cover all your liabilities.
--------------
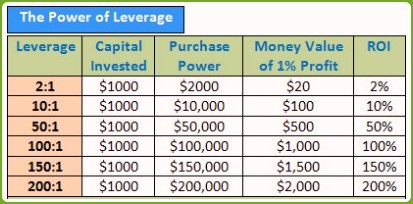
Leverage in forex = Purchase Power/Capital Invested = $100,000/$1,000 = 100
Forum on trading, automated trading systems and testing trading strategies
Something Interesting
Sergey Golubev, 2016.01.28 20:07
This is very interesting scalping EA: Angry Bird (Scalping) - expert for MetaTrader 4
Some people say that this EA looks like 'modified Ilan1.6' in trading but with more secure features concerning deposit and so on and having the following:
This is the description from the author:
This is backtesting for 4 days till now with minimal/minimum risk for deposit:
This EA was improved here (free to download) and this version does not use martingale feature (and some rules for buy/sell was changed too).
Besides, some settings (set files) were uploaded for the old/original version:
This is very interesting indicator which can be very usefull in technical analysis for example:
Daily Change (Percentage Indicator) - indicator for MetaTrader 4This indicator shows the % Daily Change of yesterday close with respect to actual price (Bid). It calculates the percentage change between yesterday close price and the actual bid price. It works on any timeframe.
The latest version of this indicator with some improvements and fixing (which I used to produce the images above) was made by roboware (thanks to him) - download from his post here.
Laguerre scalping system
Forum on trading, automated trading systems and testing trading strategies
Indicators: Laguerre
Sergey Golubev, 2013.11.04 17:37
Laguerre Scalping Trading System
Please find template for this system. Do not forget to download Laguerre indicator (other indicators already exist in Metatrader 5).
You will get chart like that (you can see confirmed buy entry on the image) :