Press review - page 468
You are missing trading opportunities:
- Free trading apps
- Over 8,000 signals for copying
- Economic news for exploring financial markets
Registration
Log in
You agree to website policy and terms of use
If you do not have an account, please register
USD/CNH Q1 2017 Forecast (based on the article)
Dollar to Chinese Yuan forecast for January 2017.
"The forecast for beginning of January 6.94. Maximum rate 7.19, while minimum 6.91. Averaged rate for month 7.02. The exchange rate at the end 7.05, change for January 1.59%."
Dollar to Chinese Yuan forecast for February 2017.
"The forecast for beginning of February 7.05. Maximum rate 7.18, while minimum 6.90. Averaged rate for month 7.04. The exchange rate at the end 7.04, change for February -0.14%."
Dollar to Chinese Yuan forecast for March 2017.
"The forecast for beginning of March 7.04. Maximum rate 7.22, while minimum 6.94. Averaged rate for month 7.07. The exchange rate at the end 7.08, change for March 0.57%."
Does Your Trading Psychology Have A Dark Side? (based on the article)
"Having worked with highly skilled traders of financial markets at a variety of money management organizations, I've noticed one distinctive marker of success: the great traders leverage one or more great strengths in their personalities and in their information processing. Those strengths differ from one exemplary money manager to another, but in each case some distinctive strength is evident."
"We recognize our strengths in our passions. It is intrinsically rewarding to exercise competencies, and so we are drawn to activities that leverage our distinctive strengths. This intrinsic interest keeps us involved in activities despite inevitable setbacks, accelerating our learning curves. It is impossible to sustain the many hours of deliberate practice needed to achieve expertise in a domain without deep, intrinsic motivation. Success results from channeling the best within us."
Consider a few examples:
True Leverage (based on the article)
What is Leverage in Forex?Leverage is your total maximum possible borrowing ratio.
What is Margin in Forex?Margin is the minimum cash deposit required by the broker to cover any open trades. It is sometimes expressed as a percentage.
What is Position Size in Forex?"Position size" is the quantity of what is being traded.
Risk of Margin CallA "margin call" is when your broker tells you that you do not have sufficient funds in your account to cover all your liabilities.
--------------
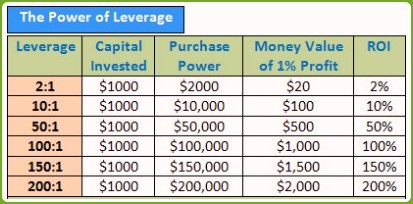
Leverage in forex = Purchase Power/Capital Invested = $100,000/$1,000 = 100
These Stocks Will Give You Massive Dividend Hikes In 2017 (based on the article)
Delta Air Lines
- "That’s not much to brag about that yield is just 1.6%. But Delta’s payout has soared 238% since the company started paying dividends in September 2013."
- "Is another big hike likely in 2017? All signs point to yes. The company is a free-cash-flow machine, generating $4.1 billion worth in the last 12 months alone, and just 9.8% of that went to dividend payments."
Weekly price is located above Ichimoku cloud in the bullish area of the chart within the following support/resistance levels:If the price breaks 52.76 resistance to above so the bullish trend will be resumed.
If the price breaks 46.60 support level so the secondary correction will be started.
If not so the price will be on bullish ranging within the levels.
How To Invest In A Time Of Fake News (based on the article)
So, as investors, what do we need to do?
Be selective
Use actively managed funds
"Avoid index funds (both mutual funds and ETFs). Pay that extra fee for a well-managed mutual fund or closed-end fund."
Avoid bonds
"Investing for a short-term use? Then, by all means, consider fixed-income securities with maturity dates matching the timing of your needs. Otherwise, avoid intermediate- and long-term bonds."
What about preferred stocks?
"The big risk in a rising rate environment is that they have no maturity date, meaning the price falls more than bonds with maturity dates."
Cash is desirable
"Cash reserves in a time of high uncertainties and rising yields are important for successful investing and mental well-being."
Finally, do not worry about taking a contrarian approach
"Being contrarian (at the right times) can earn big returns and prevent big losses. However, going against the popular grain often produces worry. The easy-to-say, hard-to-do advice is to ignore the worry. My way of doing so is to have confidence in strategies that are long on common sense and reject money-making or fear-based rationales that rely primarily on current events and ideas."
USD/JPY Intra-Day Technical Analysis - ranging on reversal (based on the article)
H1 price is located near and above SMA with period 200 (200 SMA) for the bouncing from 200 SMA value back to the primary bearish area of the chart. Bearish development retracement pattern is forming by the price for the bearish reversal to be started with 23.6% Fibo level at 117.53 to be crossed to below with 117.36 level as the nearest target to re-enter.
"The Japanese Yen has halted its decline against the USD as 2016 comes to a close. However, since September 21, when the Bank of Japan announced the significance Yield Curve Control policy or YCC, USD/JPY has now risen by as much as ~19.35% and could continue higher into 2017 given a recent message from Japan’s Chief Cabinet Secretary Yoshihide Suga in a Nikkei News Interview. The interview from Shinzo Abe’s ‘right-hand’ turned focus on the FX market as one the most critical crisis managements for his post as Chief Cabinet Secretaryis the FX market. Specifically, his focus was on creating a stable financial and economic environment for Japanese corporations so they could borrow and grow within a stable environment."
SUMMARY: ranging
TREND: waiting for directionECN and STP Forex Brokers (based on the article)
Forum on trading, automated trading systems and testing trading strategies
Press review
Sergey Golubev, 2013.07.01 07:19
Just next educational article about ECN and so on - Market Makers Vs. Electronic Communications Networks
===============
The foreign exchange market (forex or FX) is an unregulated global market in which trading does not occur on an exchange and does not have a physical address of doing business. Unlike equities, which are traded through exchanges worldwide, such as the New York Stock Exchange or the London Stock Exchange, foreign exchange transactions take place over-the-counter (OTC) between agreeable buyers and sellers from all over the world. This network of market participants is not centralized, therefore, the exchange rate of any currency pair at any one time can vary from one broker to another.
How Market Makers Work
Market makers "make" or set both the bid and the ask prices on their systems and display them publicly on their quote screens. They stand prepared to make transactions at these prices with their customers, who range from banks to retail forex traders. In doing this, market makers provide some liquidity to the market. As counterparties to each forex transaction in terms of pricing, market makers must take the opposite side of your trade. In other words, whenever you sell, they must buy from you, and vice versa.
The exchange rates that market makers set, are based on their own best interests. On paper, the way they generate profits for the company through their market-making activities, is with the spread that is charged to their customers. The spread is the difference between the bid and the ask price, and is often fixed by each market maker. Usually, spreads are kept fairly reasonable as a result of the stiff competition between numerous market makers. As counterparties, many of them will then try to hedge, or cover, your order by passing it on to someone else. There are also times in which market makers may decide to hold your order and trade against you.
There are two main types of market makers: retail and institutional. Institutional market makers can be banks or other large corporations that usually offer a bid/ask quote to other banks, institutions, ECNs or even retail market makers. Retail market makers are usually companies dedicated to offering retail forex trading services to individual traders.
Pros:
Cons:
How ECNs Work
ECNs pass on prices from multiple market participants, such as banks and market makers, as well as other traders connected to the ECN, and display the best bid/ask quotes on their trading platforms based on these prices. ECN-type brokers also serve as counterparties to forex transactions, but they operate on a settlement, rather than pricing basis. Unlike fixed spreads, which are offered by some market makers, spreads of currency pairs vary on ECNs, depending on the pair's trading activities. During very active trading periods, you can sometimes get no ECN spread at all, particularly in very liquid currency pairs such as the majors (EUR/USD, USD/JPY, GBP/USD and USD/CHF) and some currency crosses.
Electronic networks make money by charging customers a fixed commission for each transaction. Authentic ECNs do not play any role in making or setting prices, therefore, the risks of price manipulation are reduced for retail traders. (For more insight, see Direct Access Trading Systems.)
Just like with market makers, there are also two main types of ECNs: retail and institutional. Institutional ECNs relay the best bid/ask from many institutional market makers such as banks, to other banks and institutions such as hedge funds or large corporations. Retail ECNs, on the other hand, offer quotes from a few banks and other traders on the ECN to the retail trader.
Pros:
Cons:
The Bottom Line
The type of broker that you use can significantly impact your trading performance. If a broker does not execute your trades in a timely fashion at the price you want, what could have been a good trading opportunity can quickly turn into an unexpected loss; therefore, it is important that you carefully weigh the pros and cons of each broker before deciding which one to trade through.
Dow Jones Industrial Average Intra-Day Technicals (based on the article)
"Based on the consolidation that began December 14, it does appear as though DJIA may dip slightly to finish the consolidation pattern. A dip appears poised to move towards 19,750-19,840. At this point, we do not think it will extend much, but could work its way back down towards 19,000-19,250. The medium term pattern does appear incomplete to the upside. Therefore, we anticipate the dips would be supported near one of the previously cited levels."
Crude Oil Price Forecast: Early 2017 Volatility (based on the article)
"Should price fail to break the $50/51 support zone, we’ll expect an eventual move to the 2015 high in early 2017. Ichimoku also favors a Bullish continuation move."