Something Interesting - page 16
You are missing trading opportunities:
- Free trading apps
- Over 8,000 signals for copying
- Economic news for exploring financial markets
Registration
Log in
You agree to website policy and terms of use
If you do not have an account, please register
Trendsignal indicator version 2 - indicator for MetaTrader 4
TrendSignal Indicator - indicator for MetaTrader 5There is very interesting indicator for MT4 and MT5 with alerts for buy and sell (incl email alert).
Harami
This is one interesting indicator for MT5 and MT5 for searching harami pattern:
Harami indicator for Metatrader 5;
Harami indicator for Metatrader 4.
"It's just a normal search pattern Harami. You can do with it whatever you want. Personally, I find it useful on H1 charts. Position closes when a reversal characteristics as shown in the central part of the picture. Then open a long position on a 100+ pips. Watch out for feet, expose them tight enough!"
====
Forum on trading, automated trading systems and testing trading strategies
Libraries: MQL5 Wizard - Candlestick Patterns Class
Sergey Golubev, 2013.09.17 14:23
Harami
The Harami (meaning "pregnant" in Japanese) Candlestick Pattern is a reversal pattern. The pattern consists of two Candlesticks:
The Harami Pattern is considered either bullish or bearish based on the criteria below:
Bearish Harami: A bearish Harami occurs when there is a large bullish green candle on Day 1 followed by a smaller bearish or bullish candle on Day 2. The most important aspect of the bearish Harami is that prices gapped down on Day 2 and were unable to move higher back to the close of Day 1. This is a sign that uncertainty is entering the market.
Bullish Harami: A bullish Harami occurs when there is a large bearish red candle on Day 1 followed by a smaller bearish or bullish candle on Day 2. Again, the most important aspect of the bullish Harami is that prices gapped up on Day 2 and price was held up and unable to move lower back to the bearish close of Day 1.
Harami Candlestick Chart ExampleThe chart below of the Nasdaq 100 E-mini Futures contract shows an example of both a bullish and bearish Harami candlestick pattern:
The first Harami pattern shown above on the chart of the E-mini Nasdaq 100 Future is a bullish reversal Harami. First there was a long bearish red candle. Second, the market gapped up at the open. In the case above, Day 2 was a bullish candlestick, which made the bullish Harami even more bullish.
Harami Candlestick Buy SignalA buy signal could be triggered when the day after the bullish Harami occured, price rose higher, closing above the downward resistance trendline. A bullish Harami pattern and a trendline break is a potent combination resulting in a strong buy signal.
The second Harami pattern shown above on the chart of the E-mini Nasdaq 100 Future is a bearish reversal Harami. The first candle was a long bullish green candle. On the second candle, the market gapped down at the open. The chart above of the e-mini shows that Day 2 was a bearish candlestick; this made the bearish Harami even more bearish.
Harami Candlestick Sell SignalA sell signal could be triggered when the day after the bearish Harami occured, price fell even further down, closing below the upward support trendline. When combined, a bearish Harami pattern and a trendline break is a strong indication to sell.
A somewhat opposite two candlestick reversal pattern is the Bearish Engulfing PatternForum on trading, automated trading systems and testing trading strategies
Something Interesting in Financial Video November 2013
Sergey Golubev, 2013.11.18 07:49
Candlesticks - Vol 10 - Harami
CatchSpeed EA
This is for MT4 posted in CodeBase (in Russian language sorry). Link to this EA in CodeBase is here.
What is interesting? There are 7 pages of the discussion about this EA, and it was already 10 versions were uploaded by the coder on the discussion thread (discussion thread is this one). Some users are testing EA on demo or real accounts and uploading the results on the thread with the suggestion to the coder about what to improved. I traded using version #8 and the last variation of this EA - 'in-seconds' version.
EA is placing 2 pending orders (buy stop and sell stop) and moving/modifying them all the time ('in-seconds' version - the pending orders are modified in seconds, for exmple: every 5 sec, or every 15 seconds - good to trade the news events).
My setting/parameters for EURUSD M5 are the following ('in-seconds' version because this is the latest one):
Some users prefer to use USDJPY only but I am using EURUSD.
Just the situation for now:
- it was profitable trade and it was closed:
- and the EA opened new pending orders:
Hi
This link is no longer available.
Could you send me the EA by email [email address was deleted by mod]
Thank you
Rogério
Hi
This link is no longer available.
Could you send me the EA by email [email address was deleted by mod]
Thank you
Rogério
Forum on trading, automated trading systems and testing trading strategies
Something Interesting in Financial Video June 2016
Sergey Golubev, 2016.06.26 06:59
How To Trade - ADX indicator and How Does It Work
ADX indicator is used to determine the strength of the trend:
You do need to know that:
As the ADX Line is Non Directional, it does not tell you whether the market is in an uptrend or a downtrend (you must look to price or the +DI/-DI Lines for this) but simply how strong or weak the trend in the financial instrument you are analyzing is. When the ADX line is above 40 and rising this is indicative of a strong trend, and when the ADX line is below 20 and falling this is indicative of a ranging market.
So one of the first ways traders will use the ADX in their trading is as a confirmation of whether or not a financial instrument is trending, and to avoid choppy periods in the market where many find it harder to make money. In addition to a situation where the ADX line trending below 20, the developer of the indicator recommends not trading a trend based strategy when the ADX line is below both the +DI Line and the –DI Line.
How To Trade: ADX 50 trend trading strategy (adapted from the article)
Finding a strong directional move is the first priority of any trend trader. However, when having to select a currency pair to trade, it can be difficult to identify the best trends. For the ADX 50 strategy we will be using the ADX (Average Directional Index) indicator for this process. First, add a 14 period ADX to the 4Hour chart, using Daily periods.
Remember, ADX is not identifying the direction of the trend, only its intensity. If a currency pair’s trend is weak or if the pair is consolidating, ADX will read significantly lower than a strong directional market. For the ADX 50 strategy, we will only be looking for currency pairs with an ADX value of over 50! If Daily ADX reads over 50, you can then begin to move to the execution phase of the strategy.
Once a strong trend is found, it is time to plan an entry into the market. The ADX 50 trend trading strategy uses an RSI (Relative Strength Index) indicator with a 14 period setting on a 4Hour chart.
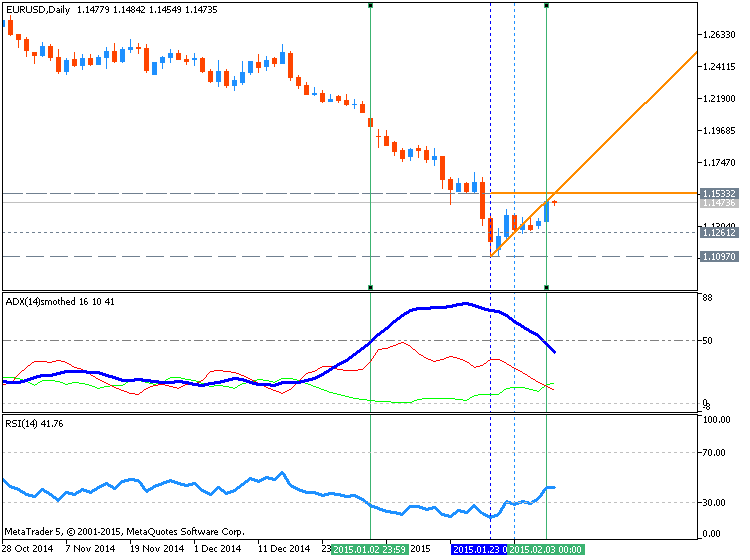
In a downtrend, new sell positions should be entered only when ADX reads over 50 and RSI closes below 30 (oversold). Conversely buy positions will be initiates when ADX reads over 50 and RSI closes above 70.Traders should always have a plan for managing their position. Eventually trends will come to an end and any existing trades should be exited. When initiating a buy order, stop orders should be placed at a 14 period low on the 4Hour chart. That way if a new low is created, all existing buy trades will be closed. Conversely if a trader is selling in a downtrend, stops can be placed at a 14 period high again using the 4Hour chart.
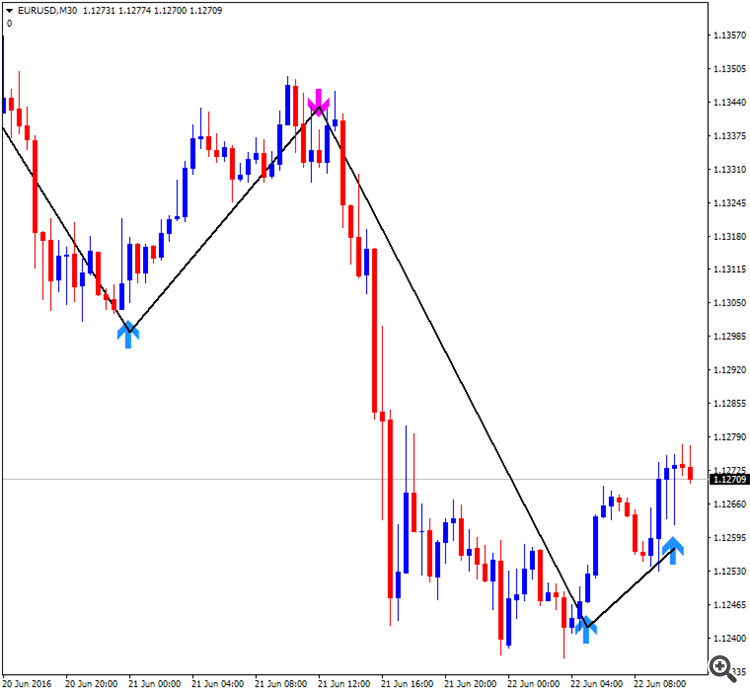
This is very interesting indicator based on ADX:
Simple Trend Visualizer - indicator for Metatrader 4
"This grid EA namely Jupiter M is building grids on both sides and may use martingale function which can be switched off by setting Multiplier parameter to 1. The main idea of the EA is the flexible grid generation."
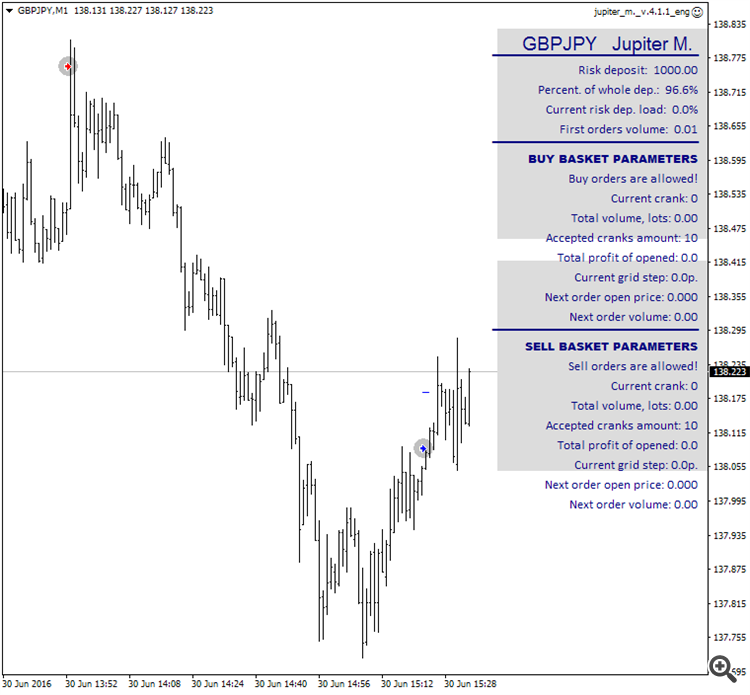
The manual (in English language) by pdf file is provided as well.
Jupiter M - expert for MetaTrader 4
"This grid EA namely Jupiter M is building grids on both sides and may use martingale function which can be switched off by setting Multiplier parameter to 1. The main idea of the EA is the flexible grid generation."
The manual (in English language) by pdf file is provided as well.
This is the statement for yesterday:
In tester this Jupiter EA trades a few times but after that no new trade opened.
Any idea?