Something Interesting in Financial Video
Ichimoku Trading Strategies For Finding Winning Trades by Hubert Senters | Real Traders Webinar
Video Manual: NON FARM PAYROLL
Non-farm Payrolls is the assessment of the total number of employees recorded in payrolls.
This is a very strong indicator that shows the change in employment in the country. The growth of this indicator characterizes the increase in employment and leads to the growth of the dollar. It is considered an indicator tending to move the market. There is a rule of thumb that an increase in its value by 200,000 per month equates to an increase in GDP by 3.0%.
- Release Frequency: monthly.
- Release Schedule: 08:30 EST, the first Friday of the month.
- Source: Bureau of Labor Statistics, U.S. Department of Labor.
=====
- Source : Bureau of Labor Statistics
- Measures : Change in the number of employed people during the previous month, excluding the farming industry
- Usual Effect : Actual > Forecast = Good for currency
- Frequency : Released monthly, usually on the first Friday after the month ends
- Why Traders Care : Job creation is an important leading indicator of consumer spending, which accounts for a majority of overall economic activity
- Also Called : Non-Farm Payrolls, NFP, Employment Change
=====
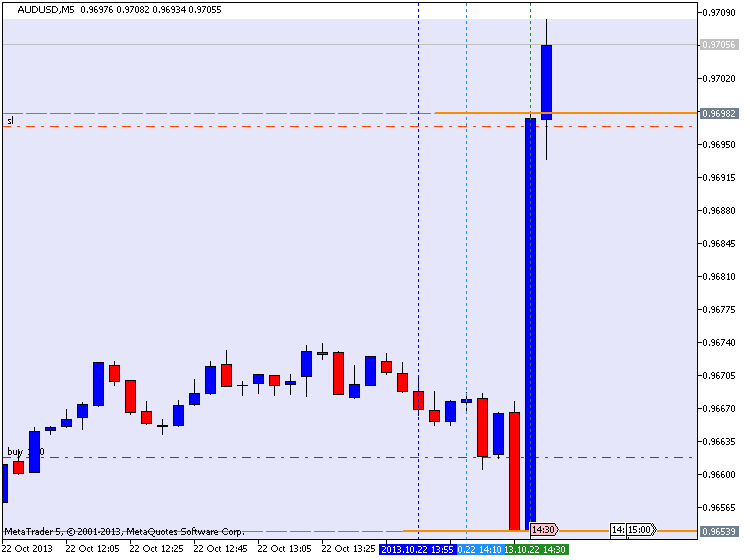
AUDUSD M5 with 45 pips in profit (by equity) for NFP :
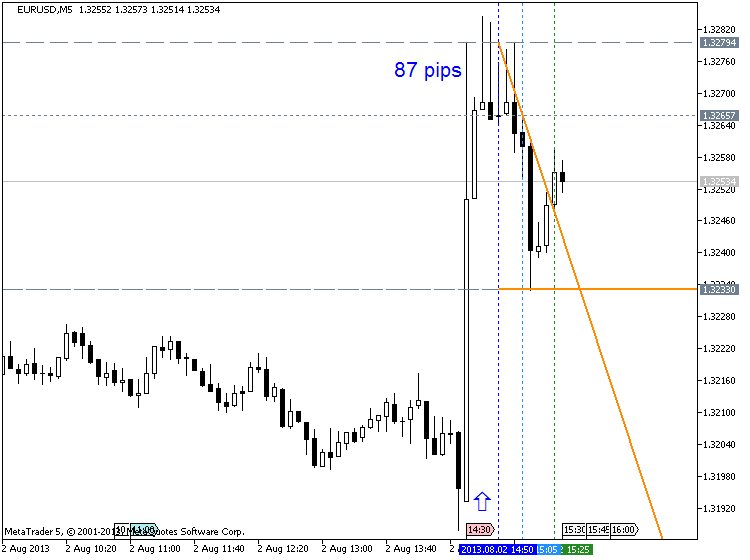
EURUSD M5 : 87 pips price movement by NFP news event :
Visualize a trading signal on a chart in MetaTrader 4/5
The effectiveness of the entry points and the unrealized profit can be easily assessed with the visualized chart of provider's deals in MetaTrader Platforms.
Ichimoku With Oversold and Overbought Levels
Here's Ichimoku compared to some other famous indicators when it adds up to showing oversold and overbought levels. Ichimoku does it all once you train yourself to see everything. No need to ad more decision makers to your chart to increase the ambiguity. Ichimoku is all you need!
- 2016.09.09
- www.mql5.com
Overbought and Oversold levels
Overbought and Oversold levels what they mean, how to trade them.
MetaTrader 5 for Android Smartphones and Tablets
Access to the Forex and Exchange markets, a large set of technical indicators and analytical objects, all types of trading orders and execution modes. Market Watch and Depth of Market, financial news and traders' chat. All these features now fit in your hand and are available anywhere in the world from your favorite smartphone.
This is an interesting video about how to trade news events (on the example of some other calendar but we can use this method to use mql5 calendar with MT4/MT5 for example).
----------------
How to Trade the News -- An Exact Method Every Trader Should Know
----------------
Economic Calendar: already available on MQL5.com, coming soon in MetaTrader 5
Forum on trading, automated trading systems and testing trading strategies
All about Calendar tab and Macro Economic Events.
Sergey Golubev, 2017.07.17 11:24
Add the new Economic Calendar widget to your website for free!
To receive the widget, go to the economic calendar page on MQL5.com and click on the "Add widget to your website" link. Specify the desired width and height of the calendar widget for your site, select the default period of featured events (current day or current week), copy the generated code and insert it to your web page. In the Preview section, you can see how the calendar will be displayed on your site.
Trade statistics, growth, equity & balance graphs of the Trading Signals of MetaTrader 4/5
Trade statistics is a detailed information on a signal, that will help you to make a wise decision. Growth, equity & balance graphs allow you to visually estimate a successful provider directly in MetaTrader Platforms.
Learn how to build an automated trading Robot - Part 1 (Free Robot)
- Free trading apps
- Over 8,000 signals for copying
- Economic news for exploring financial markets
You agree to website policy and terms of use
Please upload forex video you consider as interesting one. No direct advertising and no offtopic please.
The comments without video will be deleted.