Something Interesting in Financial Video December 2016
The Hidden Secret of Technical Analysis
Discover a whole 'other world' of technical analysis, where novice traders fear to go.
- Technical Analysis: How Do We Analyze?
- Technical Analysis vs Fundamentals: How Reliable are Technicals ?
- Technical Analysis for Idiots - My Market Theory.
- Technical Analysis Course - Module 1: Technical Analysis and the Dow Theory
- Technical Analysis Course - Module 2: Charting Basics
- Technical Analysis Course - Module 3: Trend Concepts
- Technical Analysis Course - Module 4: Reversal and Continuation Patterns
- Technical Analysis Course - Module 5: Volume and Open Interest
- Technical Analysis Course - Module 6: Moving Averages
- Technical Analysis Course - Module 7: Oscillators and Sentiment Indicators
- Technical Analysis Course - Module 8: Further Charting
- Technical Analysis Course - Module 9: Elliott Waves and Cycles of Time
- Technical Analysis Course - Module 10: Cloud Charts: the Ichimoku Technique
- Technical Analysis Course - Module 11: Money Management and Computers
- Technical Analysis Course - Module 12: How to Build a Trading Systems
- Technical Analysis Course - Module 13: The Stock Market
- Technical Analysis Course - Module 14: Futures
- Technical Analysis Course - Module 15: Options
- Technical Analysis Course - Module 16: Forex Trading
- Technical Analysis Course - Module 17: Strategies and Trading Principle
Recently i saw some people interested in fix api trading, some ask about MetaTrader 5 fix api which is currently unavailable. But for general knowledge and getting to know about what is Fix API trading will be a good thing especially for people who want to venture into HFT.
This video give introduction to FIX API trading, the pro and cons, setup and so on.
Forum on trading, automated trading systems and testing trading strategies
Something Interesting in Financial Video May 2014
Sergey Golubev, 2014.05.12 08:54
Ichimoku Kinko Hyo Trading System
A brief look at the terminology, signals and methods for taking trades using Ichimoku Kinko Hyo.
More video on this subject:
- Ichimoku - about this indicator in general, what every line of this indicator means.
- Ichimoku cloud, how to use it with trading
- Ichimoku Trading - Ichimoku Training - Support and Resistance with the Ichimoku Cloud Trading
- Kumo Breakout Trading with the Ichimoku System.
- Ichimoku vs Moving Average Trade Analysis.
- Ichimoku vs Moving Average Trade Analysis
- Technical Analysis Course - Module 10: Cloud Charts: the Ichimoku Technique
- Ichimoku - Drawbacks Of Ichimoku Kinko Hyo
- Ichimoku - Ideal Ichimoku ScenariosIchimoku - Kumo Cloud Studies I
- Ichimoku - Multiple Confirmation
==============
Ichimoku threads/posts on mql5.com forum
- The theory of the signals
- Ichimoku alert indicator with arrows
- Ichimoku alert indicator improved : warning alert mode was fixed and autosettings feature was added
=============
Ichimoku indicator description
- Tenkan Sen - moving average of the highest high and lowest low over the last 9 trading days. (Highest high + Lowest low) / 2 over the last 9 trading days
- Kijun Sen - moving average of the highest high and lowest low over the last 26 trading days. (Highest high + Lowest low) / 2 over the last 26 trading days.
- Senkou Span A - the average of the Tenkan Sen and Kijun Sen, plotted 26 days ahead. (Tenkan Sen + Kijun Sen) / 2 plotted 26 days ahead
- Senkou Span B
- the average of the highest high and lowest low over the last 52 days,
plotted 26 days ahead. (Highest high + Lowest low) / 2 over the last 52
trading days plotted 26 days ahead.
- Chikou Span - the closing price plotted 26 days behind.
=============
Forum on trading, automated trading systems and testing trading strategies
Sergey Golubev, 2013.11.25 12:23
Ichimoku Cloud (based on The Definitive Guide to Trading Trends with Ichimoku Cloud article)
Many traders are asked what indicator they would
wish to never do without. The answer has never wavered as there is one
indicator that clearly illustrates the current trend, helps you time
entries, displays support and resistance, clarifies momentum, and shows
you when a trend has likely reversed. That indicator is Ichimoku Kinko
Hyo or more casually known as Ichimoku.
Ichimoku is a technical or chart indicator that is also a trend trading system in and of itself. The creator of the indicator, Goichi Hosada, introduced Ichimoku as a “one glance” indicator so that in a few seconds you are able to determine whether a tradable trend is present or if you should wait for a better set-up on a specific pair.
Before we break
down the components of the indicator in a clear and relatable manner,
there are a few helpful things to understand. Ichimoku can be used in
both rising and falling markets and can be used in all time frames for
any liquid trading instrument. The only time to not use Ichimoku is when
no clear trend is present.
Always Start With the Cloud
The cloud is
composed of two dynamic lines that are meant to serve multiple
functions. However, the primary purpose of the cloud is to help you
identify the trend of current price in relation to past price action.
Given that protecting your capital is the main battle every trader must
face, the cloud helps you to place stops and recognize when you should
be bullish or bearish. Many traders will focus on candlesticks or price
action analysis around the cloud to see if a decisive reversal or
continuation pattern is taking shape.
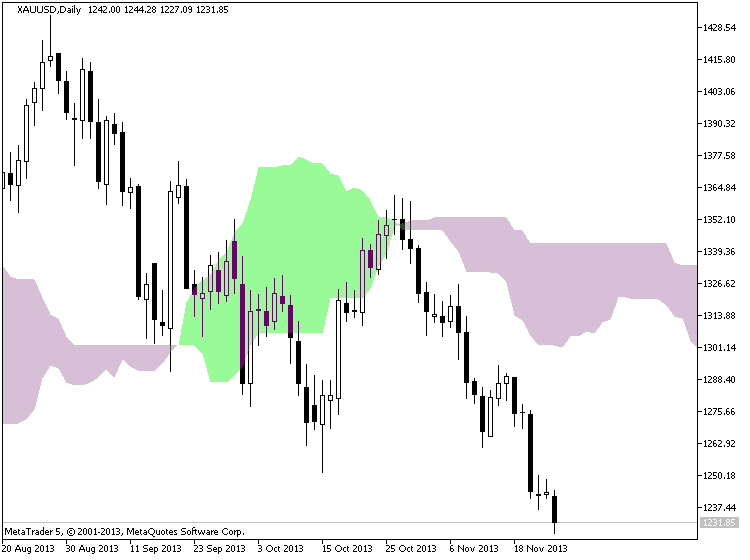
In the simplest terms, traders who utilize Ichimoku should look for buying entries when price is above the cloud. When price is below the cloud, traders should be looking for temporary corrections higher to enter a sell order in the direction of the trend. The cloud is the cornerstone of all Ichimoku analysis and as such it is the most vital aspect to the indicator.
Time Entries with the Trigger & Base Line
Once you have
built a bias of whether to look for buy or sell signals with the cloud,
you can then turn to the two unique moving averages provided by
Ichimoku. The fast moving average is a 9 period moving average and the
slow moving average is a 26 period moving average by default. What is
unique about these moving averages is that unlike their western
counterparts, the calculation is built on mid-prices as opposed to
closing prices. I often refer to the fast moving average as the trigger
line and the slow moving average as the base line.
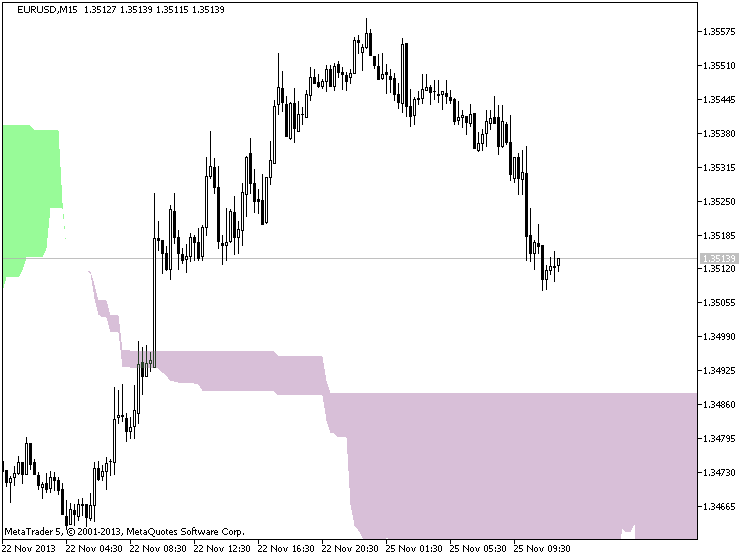
The Ichimoku components are introduced in a specific order because that is how you should analyze or trade the market. Once you’ve confirmed the trend by recognizing price as being below or above the cloud, you can move to the moving averages. If price is above the cloud and the trigger crosses above the base line you have the makings of a buy signal. If price is below the cloud and the trigger crosses below the base line you have the makings of a sell signal.
Confirm Entries with the Mysterious Lagging Line
In addition to the mystery of the cloud, the lagging line often confuses traders. This shouldn’t be the case as it’s a very simple line that is the close of the current candle pushed back 26 periods. When studying Ichimoku, I found that this line was considered by most traditional Japanese traders who utilize mainly Ichimoku as one of the most important components of the indicator.
Once price has broken above or below the cloud and the trigger line is crossing the base line with the trend, you can look to the lagging line as confirmation. The lagging line can best confirm the trade by breaking either above the cloud in a new uptrend or below the cloud in a developing downtrend. Looking above, you can see that the trend often gathers steam nicely after the lagging line breaks through the cloud. Another benefit of using the lagging line as a confirmation indicator is that the lagging line can build patience and discipline in your trading because you won’t be chasing the initial thrust but rather waiting for the correction to play out before entering in the direction of the overall trend.
Trading With Ichimoku Checklist
Now that you know the components of Ichimoku here is a checklist that you can print off or use to keep the main components of this dynamic trend following system:
Ichimoku Checklist:
1.Where is Price in Relation to the Cloud?
- Above the cloud -filtered for buy only signals
- In the Cloud - be cautious but ready to jump in on the prior trend or finesse a current position. what the candle stick formations heavily
- Below the cloud - filtered for short only trades
2. Is price consistently on one side of the cloud or is price whipping around on both sides consistently?
- Ichimoku is best used with clear trends and should be set aside during ranging markets.
3. Which level of the Ichimoku would like to use to place your stop?
- If you use Ichimoku to place stops as well, you can either use the cloud or the base line.
Trading The Martingale and Anti Martingale Strategies
In our last lesson we looked at how most traders pick a standard amount to trade per certain amount of equity in their account and how this probably isn't the best way to maximize profits and minimize losses of a potential strategy. In today's lesson we are going to look at the two categories that most position sizing strategies fall into which are known as martingale strategies and anti martingale strategies.
A position sizing strategy which incorporates the martingale technique is basically any strategy which increases the trade size as a trade moves against the trader or after a losing trade. On the flip side a position sizing strategy which incorporates the anti martingale technique is basically any strategy which increases the trade size as the trade moves in the traders favor or after a winning trade.
The most basic martingale strategy is one in which the trader trades a set position size at the beginning of his trading strategy and then double's the size of his trades after each unprofitable trade, returning back to the original position size only after a profitable trade. Using this strategy no matter how large the string of losing trades a trader faces, on the next winning trade they will make up all their losses plus a profit equal to the profit on their original trade size.
As an example lets say that a trader is using a strategy on the full size EUR/USD Forex contract thattakes profitsand losses both at the 200 point level (I like using the EUR/USD Forex contract because it has a fixed point value of $1 per contract for mini forex contracts and $10 per contract for full sized contracts but the example is the same for any instrument)
The trader starts with $100,000 in his account and decides that his starting position size will be 3 contracts (300,000) and that he will use the basic martingale strategy to place his trades. Using the below 10 trades here is how it would work.
As you can see from the example although the trader was down significantly going into the 10th trade, as the 10th trade was profitable he made up all the his losses plus a brought the account profitable by the equity high of the account plus original profit target of $6000.
At first glance the above method can seem very sound and people often point to their perception that the chances of having a winning trade increase after a string of loosing trades. Mathematically however the large majority of strategies work like flipping a coin, in that the chances of having a profitable trade on the next trade is completely independent of how many profitable or unprofitable trades one has leading up to that trade. As when flipping a coin no matter how many times you flip heads the chances of flipping tails on the next flip of the coin are still 50/50.
The second problem with this method is that it requires an unlimited amount of money to ensure success. Looking at our trade example again but replacing the last trade with another loosing trade instead of a winner, you can see that the trader is now in a position where, at the normal $1000 per contract margin level required, he does not have enough money in his account to put up the necessary margin which is required to initiate the next 48 contract position
So while the pure martingale strategy and variations of it can produce successful results for extended periods of time, as I hope the above shows, odds are that it will eventually end up in blowing ones account completely.
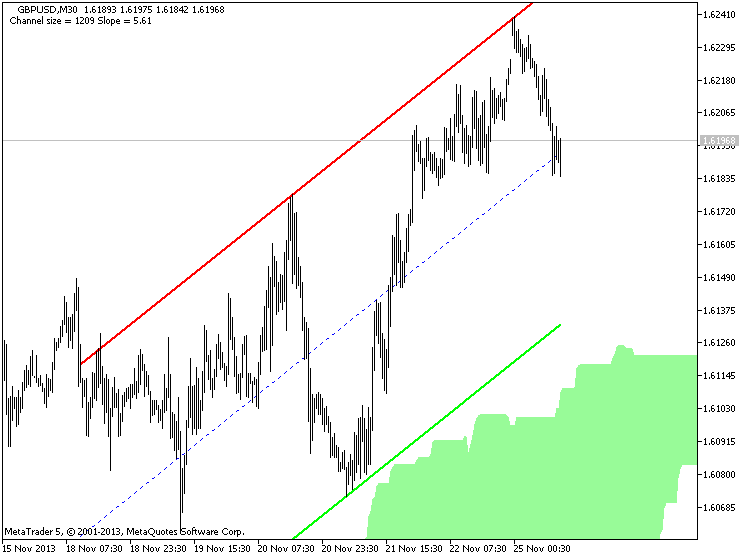
In this video we will learned about turtle trading strategy. The author giving brief setup of the price channel setting, entry and exit point.
Forum on trading, automated trading systems and testing trading strategies
Something Interesting in Financial Video April 2014
Sergey Golubev, 2014.04.10 09:27
Forex News - How to Trade News Announcements
"Use the Forex News"
One of the reasons so many forex traders
come to the Forex market is because of the potential to make fast money.
With huge amounts of leverage, and extremely volatile price movements,
many traders look to focus on trading forex news since this can produce
some of the fastest movements that the forex market might see.
Unfortunately,
a lot of these types of traders will fail. Forex news can be
notoriously difficult to trade as price movements can be so wild and
volatile. Not only can these movements be unpredictable, but forex
traders will often employ sloppy risk management and end up turning a
short-term trade into a long-term problem.
There has to be a better way to do this.
Some
traders choose to just avoid trading forex news, or those trading
longer-term strategies often try to 'trade around them.' But there are a few different ways to try to "use the
forex news".
For one, since these price movements can be so wild
and volatile, it may offer longer-term forex traders the opportunity to
get a better entry price than they would have initially anticipated.
Let's
say that the EURUSD is trading at 1.3000, and a trader wants to go long
with a 100 pip stop and a 300 pip profit target; but NFP is 30 minutes
away and our traders doesn't want to take the risk of losing 100 pips so
shortly after placing a trade designed to be open for a few days. So
our trader waits...
Once NFP comes out, the trader sees price
hurry down to 1.2950 before finding support shortly after the data was
announced. Our trader can then buy, keeping their stop at 1.2900, and
now can look for a 350 pip profit target. Their original risk-reward
was going to be 1-to-3. Now, it can be 1-to-7, and they were able to
get long the EURUSD at a much better price.
The other way to use the forex news is to trade the volatility that can come from news announcements. This involves placing an entry order to go long above resistance, and an entry order to go short below support. This way, if the volatility from the news release creates a price movement that could go on for days, forex traders could potentially enter at the early portion of the move as prices initially move on to make new highs or lows.
John Ehlers - Anticipating Turning Points
- Market Data is Fractal -- Longer waves have bigger swings than shorter waves.
- Spectral Dilation describes data over the full range of tradable cycles.
- Aliasing noise swamps shorter wave data.
- Aliasing noise is best removed using a SuperSmoother filter.
- Spectral Dilation effects are mitigated by a Roofing Filter.
- Price turning points must be anticipated for effective swing trading.
- Trading System Performance is best evaluated using Monte Carlo techniques.
Al Brooks - Distinguishing ranges, trends, and continuations
- Distinguishing strong legs within a trading range from those within a trend
- When there is a strong move, look for early signs of evolution into a trading range
- If the evidence favors a trading range, bet breakouts will fail, which means BLSHS (Buy Low, Sell High, Scalp)
- B 2nd leg traps are common
- Experience traders scale in
- Don't force trades within tight trading ranges
- Free trading apps
- Over 8,000 signals for copying
- Economic news for exploring financial markets
You agree to website policy and terms of use
Please upload forex video you consider as interesting one. No direct advertising and no offtopic please.
The comments without video will be deleted.