Something Interesting in Financial Video - page 33
You are missing trading opportunities:
- Free trading apps
- Over 8,000 signals for copying
- Economic news for exploring financial markets
Registration
Log in
You agree to website policy and terms of use
If you do not have an account, please register
Forum on trading, automated trading systems and testing trading strategies
Programming tutorials
MetaQuotes, 2023.05.24 16:54
Moving Average Crossover EA mql5 Programming
Moving Average Crossover EA mql5 Programming
Hi, this is Toby, and in today's video, I'll show you how to code a simple moving average crossover expert advisor for MetaTrader 5. Let's get started.
First, let's define what we want the expert advisor to do. We want the EA to open a buy position when the fast moving average (blue line) crosses above the slow moving average (red line) and open a sell position when the fast moving average crosses below the slow moving average. We'll also add a stop loss and take profit to the EA, as well as input variables for the periods of the moving averages.
To begin coding, open the MetaEditor in MetaTrader 5. Create a new expert advisor using the template and name it "Moving Average." Clean up the code by removing unnecessary lines and comments. Next, add input variables for the periods of the fast and slow moving averages. Set default values for these variables and display them in the input tab of the EA settings.
Check the user input in the OnInit function to ensure valid values are entered. If the input is invalid (zero or negative), display an alert message and stop the EA. Create handles for the fast and slow moving averages using the ma function. Set the symbol, period, and input variables for each moving average. Check if the creation of handles is successful. If not, display an alert message and stop the EA. Create global variables for storing the indicator values. Use dynamic arrays for the fast and slow buffers. In the OnTick function, copy the latest indicator values into the buffers and check if enough data is available. If not, return and display an alert message.
Print the indicator values on the screen to verify if everything is working correctly. Use the Comment function to display the values of the fast and slow moving averages.
In the Strategy Tester, test the EA to check if the indicator values are displayed correctly. Now, we can check for a crossover of the moving averages. If the fast moving average is below the slow moving average at bar 1 and above the slow moving average at bar 0, we have a crossover. Open a buy position in this case.
To open positions, use the CTrade class. Define a trade variable and proceed with the necessary actions. Compile the code and test the EA in the Strategy Tester to verify if the crossover condition is working correctly and positions are opened accordingly.
That's it for coding the moving average crossover expert advisor in MetaTrader 5. And then we can use the trade.Buy function to open a buy position. We specify the volume of the position, which can be a fixed value or based on your risk management strategy. For now, let's use a fixed volume of 0.1 lots. Now we need to add a condition to check for a sell position. If the fast moving average is above the slow moving average for bar 1 and below for the current bar, we have a crossover in the opposite direction. In this case, we want to open a sell position. We can use the trade.Sell function to do that.
Finally, we can add a stop loss and take profit to our positions. We'll use the trade.SetStopLoss and trade.SetTakeProfit functions. Let's set a stop loss of 100 pips and take profit of 200 pips for this example. Now we have a complete code for our simple moving average crossover expert advisor. We can compile it and test it in the MetaTrader 5 platform.
Once you have compiled the code without any errors, you can save the expert advisor and use it in MetaTrader 5. Remember to backtest and optimize your expert advisor before using it with real money.
Forum on trading, automated trading systems and testing trading strategies
Quantitative trading
MetaQuotes, 2023.05.12 14:25
Basics of Quantitative Trading
Basics of Quantitative Trading
In this video on the basics of quantitative trading, algorithmic trader Shaun Overton discusses the challenges and opportunities involved in algorithmic trading. Overton explains that data collection, analysis, and trading are the three simple problems involved in algorithmic trading, though the process can get complicated due to finding high-quality data and proper analysis. It can be challenging to select the right platform with good data and features to meet the trader's goals, with the most popular platforms being MetaTrader, NinjaTrader, and TradeStation, depending on the trading type one prefers. Overton also discusses the harsh reality of how easy it is to blow up accounts when trading in the live market, and how important it is to manage risk. Additionally, he explains how quantitative traders can predict overextended moves in the market and discusses the impact of currency wars.
The "Basics of Quantitative Trading" video on YouTube covers various strategies for algorithmic trading, including sentiment analysis and long-term strategies based on chart lines; however, the biggest returns are made during big tail events and trends. Attendees of the video discuss different platforms for backtesting, challenges of integrating multiple platforms for trading analysis, and the increasing interest in formalizing and automating trading strategies. Some long-term traders seek automation as they have been in the game for a long time, and NinjaTrader for programming languages is recommended but has limitations.
Doji Candlestick Chart Pattern
The Doji is a important Candlestick formation, signalling indecision between bulls and bears. A Doji is formed when the opening price and the closing price are equal. In a Doji chart pattern, the stock market moves up and down during the trading session, but cannot commit either way.
Forum on trading, automated trading systems and testing trading strategies
Something Interesting
Sergey Golubev, 2023.08.10 06:46
Trading strategy based on the improved Doji candlestick pattern recognition indicator - the article
The article "Improved candlestick pattern recognition illustrated by the example of Doji" dealt with the concept of metabars. In short, a metabar is a conditional combination of several consecutive bars into a large one. This is similar to a bar of a higher timeframe, but not exactly, since the size of the metabar is not fixed (it "floats" in a given range) and there is no binding to a specific start and end time of the bar. Therefore, the use of metabars allows traders to detect various patterns of candlestick analysis much more often.
How to Trade Spinning Tops and Doji Candlestick Patterns
In our last lesson we learned how different candlestick formations can tell us different things about whether the buyers or the sellers won out in a particular time period. In today's lesson we are going to look at some of the basic candlestick patterns and what they mean when looked at in the context of recent price action in the market.
The Spinning Top
When a candlestick with a short body in the middle of two long wicks forms in the market this is indicative of a situation where neither the buyers nor the sellers have won for that time period as the market has closed relatively unchanged from where it opened. The upper and lower long wicks however tell us that both the buyers and the sellers had the upper hand at some point during the time period the candle represents. When you see this type of candlestick form after a runup or run down in the market it can be an indication of a pending reversal as the indescision in the market is representative of the buyers loosing momentum when this occurs after an uptrend and the sellers loosing momentum after a downtrend.
The Doji
Like the Spinning Top the Doji Represents indecision in the market but is normally considered a stronger signal because unlike the spinning top the open and the close that form the Doji Candle are at the same level. If a Doji forms in sideways market action this is not significant as the sideways market action is already indicative of indecision in the market. If the Doji forms in an uptrend or downtrend this is normally seen as significant as this is a signal that the buyers are loosing conviction when formed in an uptrend and a signal that sellers are loosing conviction if seen in a downtrend. Most traders will place greater significance on the Doji when it forms in a market that is in overbought or oversold territory.
The Bullish Engulfing Pattern
The Bullish Engulfing pattern is another candlestick formation which represents a potential reversal in the market when seen in a downtrend. The pattern is made up of a white and black candle where the latest candle (the white candle) opens lower than the previous candle's (the black candle) close and closes higher than the previous candle's open. When this happens the current period's white candle completely engulfs the previous period's black candle.
When thinking about this from a buyer/seller perspective, you can understand that the long body of the current candle engulfing completely the body of the previous candle to the upside is representative that the buyers have not only taken control but have taken control with force. When this white engulfing candle occurs after a small black candle the formation is given even more significance as the small black candle is already indicative of a trend that is running low on steam.
Forum on trading, automated trading systems and testing trading strategies
MetaEditor, Open AI and ChatGPT
Sergey Golubev, 2023.11.16 12:49
Regression models of the Scikit-learn Library and their export to ONNX
Netron is a viewer for neural network, deep learning and machine learning models
s
For more details about Netron, refer to the articles: Visualizing your Neural Network with Netron and Visualize Keras Neural Networks with Netron
-----------------------
Quick look into Netron
( We look into the machine learning network viewer Netron )
Netron - Network Visualization Tool | Machine Learning | Data Magic
( In this episode will talk about ,How to visualise a Deep Neural Network with the help of Netron API )
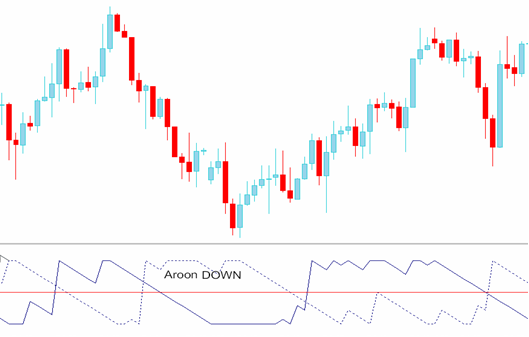
How to use Aroon indicator (based on the article)
The indicator was developed by Tushar Chande.
The Aroon indicator is used to determine if a trading instrument is trending or not. It is also used to indicate how strong the trend is. Indicator is used to identify the beginning of a trend, the name aroon means morning or dawn. This indicator is used to identify a trend early thus its name.
The Aroon indicator has two lines
Aroon UP
Percentage of time between the start of a time period and the highest point that price has reached during that period. If price sets a new high Aroon UP will be 100. For each new high Aroon stays at 100. However, if price moves down by a certain percentage, then that percentage is subtracted from the 100 and Aroon UP starts to move down. This means that if Aroon UP stays at 100 then price is making new highs but when it starts to move down then price is not making new highs.
Aroon DOWN
Aroon DOWN is Calculated the same as Aroon UP but this time using the lowest point instead of the highest point. When a new low is set Aroon DOWN is at 100 and when a new high is set Aroon DOWN is at Zero.
Technical Analysis by Aroon Indicator - Buy Signal and exit signal
Aroon UP above 50 is a technical buy signal. Aroon UP dipping below 50 is an exit signal if you had bought the currency.
Sell Signal and Exit Signal
Aroon DOWN below 50 is a technical sell signal. Aroon UP rising above 50 is an exit signal if you had sold the currency.
Video Tutorial
Free to Download
MT5 indicators
MT4 indicators
--------------------------
Building and testing Aroon Trading Systems
This type of article is very helpful to you because it can be consumed in a little time than you need to do the work by yourself to find a good setup of the trading system, but you still need to work after finding what is interesting for your way to dive more and optimize until reaching to the ultimate results that can be profitable for your trading. We just try to present here trading tools that can be used individually or in combination with other tools to save you time in finding what you need to focus on and develop it more in your favor. It also provides how to code these systems to be tested in the Strategy Tester, which means you can save a lot of time by automating your testing process instead of testing manually.
We will cover the following topics in this article:
Basic Terms for Price Behavior:
Trend: 2 successively higher tops and bottoms (uptrend) / 2 successively lower tops and bottoms (downtrend)
Other names for a positive trend: run up/bull run/rally
Other names for a negative trend: run down/bear run/decline
Trading range: the market moves up and down within a consistent range without establishing a definitive trend in one direction
Consolidation: the range of price's movement constricts as the market becomes directionless
Reversal: the market moves in the opposite direction from the previous trend, implying the end of that trend
Retrace: the market moves some amount in the opposite direction from the previous trend before the trend is eventually reinstated
2 Attempts Rule: the idea that if the market attempts to do something twice and fails, the opposite will happen
Support and Resistance
In a trading range, or even within a trend, price action frequently seems influenced by or adherent to levels that have previously been significant turning points in its history; on the price action trader's charts, these levels are marked as lines offering potential support and resistance to future price action; lines drawn above the current price constitute resistance, while lines drawn below it are support. If either of these levels are broken, the function of the line is reversed, so, for example, if price breaks through a resistance line, that line can now be understood as a support line to future price action.
Support and resistance lines are typically horizontal, but when they are diagonal along a trend they are known as trend lines.
As an example (see video), I marked some significant support and resistance levels on this chart of the euro US dollar pair. This lowest level at about 1.34 is established as the point where the initial trend in mid September is arrested and turns briefly bearish. After the first bullish bear tops out at this level, the two bearish bars thereafter max out as though they are experiencing resistance from the same level before a break-through on September 16th. At this point, the resistance becomes support, and we can see that two months later, in mid November, this support level is tested and holds, as price rises back up for the rest of the month. If you recall the two-attempt rule that I explained, we can see that in action with this highest resistance level at about 1.383. We would draw this line in because it represents the height of the bullish trend extending from the beginning of this chart to late October. We can see that price returns close to this level in the next trend peak in mid December, and then finally tests it with the wick of this candle at the end of the month. Since the level is reached, but price fails to definitively break through, we can expect a reversal based on the two-attempt rule, and that's exactly what we've seen since the end of December.
So, the basic idea behind using support and resistance effectively in a trading range is to buy at the support level and sell at resistance in an uptrend, or to sell at resistance and buy at support in a downtrend; so, we're not necessarily hoping for a break-out through the established levels, because a break-out means that the market isn't behaving predictably enough to allow for safe bets on its future performance. Instead, the most conservative or reliable trades are those that occur as the market fluctuates between identifiable support and resistance levels, allowing you, in an uptrend, to buy when a retracement of bearish leg has brought prices down to a support level, and then sell when price returns to the resistance level, or, in a downtrend, to sell when price is maxed out at a reliable resistance level. The reason we are looking to buy in an uptrend and sell in a downtrend is that price action trading is all about playing the odds, so trading with the trend rather than against it is usually a better idea since a trend is statistically more likely to continue than to reverse
So, before we move on to some basic set-ups and stop placement, here are a few more important terms now that we have a sense of support and resistance.
Break-out: the market breaks out of a trading range or a resistance level
Clear-out: the market's break-out in one direction is quickly followed by its movement in the opposite direction
Throwback: retracement after a break above
Pullback: retracement after a break below
How to identify a strong Support and Resistance?
Support and Resistance is one of the most popular topics amongst traders. But S&R is not just about drawing lines. How do you know which Support and Resistance the price may react from? In this video, Navin explains the key elements that make a strong S&R.