Press review - page 576


USD/CNH Intra-Day Fundamentals: Caixin Manufacturing PMI and range price movement 

2017-12-01 01:45 GMT | [CNY - Caixin Manufacturing PMI]

if actual > forecast (or previous one) = good for currency (for CNY in our case)

[CNY - Caixin Manufacturing PMI] = Level of a diffusion index based on surveyed purchasing managers in the manufacturing industry. 

==========

From official report :

  • "Chinese manufacturing sector operating conditions continued to improve in November, albeit at a marginal pace. Output and new orders both rose only modestly, leading to a softer expansion in buying activity. At the same time, companies faced a further sharp increase in average input costs, that led to a notable rise in selling prices. Efforts to cut costs contributed to another fall in staffing levels, with the rate of decline quickening to a three-month record."
  • "The seasonally adjusted Purchasing Managers’ Index™ (PMI™) – a composite indicator designed to provide a single-figure snapshot of operating conditions in the manufacturing economy – registered 50.8 in November, down from 51.0 in October. While remaining above the crucial 50.0 value, the index dipped to its lowest level for five months to signal only a marginal upturn in operating conditions."

==========

USD/CNH M15: range price movement by Caixin Manufacturing PMI news event 


==========

The chart was made on M5 timeframe with standard indicators of Metatrader 4 except the following indicator (free to download):


Crude Oil - weekly bullish eranging within narrow levels for direction (based on the article)

Weekly price is above Ichimoku cloud in the bullish area of the chart: the price is on ranging within the narrow 64.63/61.16 s/r levels for the bullish trend to be resumed or for the secondary correction to be started.


  • "The 173rd OPEC Meeting concluded with the expected decision to extend the OPEC production cuts for an additional 9 months (January 2018 through December 2018) but during the 3rd OPEC and non-OPEC ministerial meeting, ministers added a provision to review the production cuts based on market fundamentals at the June 2018 OPEC meeting.  The extension was the outcome that Saudi oil minister Khalid al Falih wanted and the provision to review was clearly a concession to Russian oil minister Alexander Novak's position."
  • "Following news of the OPEC agreement, the price of both Brent and WTI rose, but as the non-OPEC component of the meeting began prices started to decline. As the ministers delivered their final remarks prices again rose as all parties remained committed to the production cuts."

==========

The chart was made on W1 timeframe with standard indicators of Metatrader 5 except the following indicator (free to download):

MaksiGen_Range_Move MTF - indicator for MetaTrader 5


USD/CAD Intra-Day FundamentalsCanada GDP and range price movement 

2017-12-01 13:30 GMT | [CAD - GDP]

  • past data is -0.1%
  • forecast data is 0.1%
  • actual data is 0.2% according to the latest press release

if actual > forecast (or previous one) = good for currency (for CAD in our case)

[CAD - GDP] = Change in the inflation-adjusted value of all goods and services produced by the economy. 

==========

From official report :

  • "Real gross domestic product (GDP) rose 0.2% in September after edging down 0.1% in August. Goods-producing (+0.4%) and services-producing (+0.1%) industries rose as 12 of 20 industrial sectors grew, led by the mining, quarrying and oil and gas extraction sector."

==========

USD/CAD M15: range price movement by Canada GDP news event 


==========

The chart was made on W1 timeframe with standard indicators of Metatrader 5 except the following indicator (free to download):

MaksiGen_Range_Move MTF - indicator for MetaTrader 5


S&P 500 - daily bullish with 2,657 as a target (based on the article)

Daily price is very far above Ichimoku cloud in the bullish area of the chart: the price is testing resistance level at 2,657 to above for the bullish trend to be continuing.


  • "In 2016 the average forecast was 5% below where the S&P 500 ended the year.  It looks as though they are going to do even worse in 2017 as the average S&P 500 forecast from the start of the year was for it to close at 2359. In fact several were looking for the S&P 500 to close lower in 2017."
  • "Last summer Goldman Sachs was sticking with their year-end target at 2300 even though the S&P 500 was already trading above 2400.  In July some of the other Wall Street strategists started to raise their forecasts."
  • "In fact listening to their bullish calls during 2000-2002 would have resulted in a 50% loss. For 2018 the average a year-end target for the S&P 500 is 2800. The current high forecast is 2950 but expect this to change in early 2018."

============

Chart was made on MT5 with BrainTrading system (MT5) from this thread (free to download) as well as the following indicators from CodeBase:

All about BrainTrading system for MT5:


Weekly Outlook: 2017, December 03 - December 10 (based on the article)

The US dollar managed to recover in the week after Thanksgiving on positive data, upbeat Fed statements, imminent tax cuts, and despite a major development in Trump’s troubles. The Non-Farm Payrolls is the key event and we also have rate decisions from Australia and Canada Here are the highlights for the upcoming week.


    1. Australian rate decision: Tuesday, 3:30. This is the last decision of the year and the RBA does not meet in January. They are not expected to make any change now.
    2. ISM Non-Manufacturing PMI: Tuesday, 15:00. The figure for November is projected to be slightly lower: 59.2 points.
    3. Australian GDP: Wednesday, 00:30. We may get a slower growth rate for Q3: 0.7% according to the projections.
    4. ADP Non-Farm Payrolls: Wednesday, 13:15. A more moderate gain of 191K jobs is estimated.
    5. Canadian rate decision: Wednesday, 15:00. Markets still expect the BOC to hike in 2018, but nothing is certain.
    6. Mario Draghi talks Thursday, 16:00. The President of the ECB will hold a press conference in front of the Bank of International Settlements. This comes one week before the central bank makes its decision and also publishes new forecasts. Draghi may react to the upbeat growth figures, but also to the latest disappointment in inflation developments. He usually moves the euro.
    7. Japanese GDP: Thursday, 23:50. An upgrade to 0.4% q/q is on the cards.
    8. US Non-Farm Payrolls: Friday, 13:30. This is the last NFP before the Fed decision in December, in which Yellen is expected to complete 3 hikes in 2017. Only a terrible report would derail the hike.
    9. US consumer confidence: Friday, 15:00. All in all, consumers are quite confident, also according to other surveys such as the CB one.
     

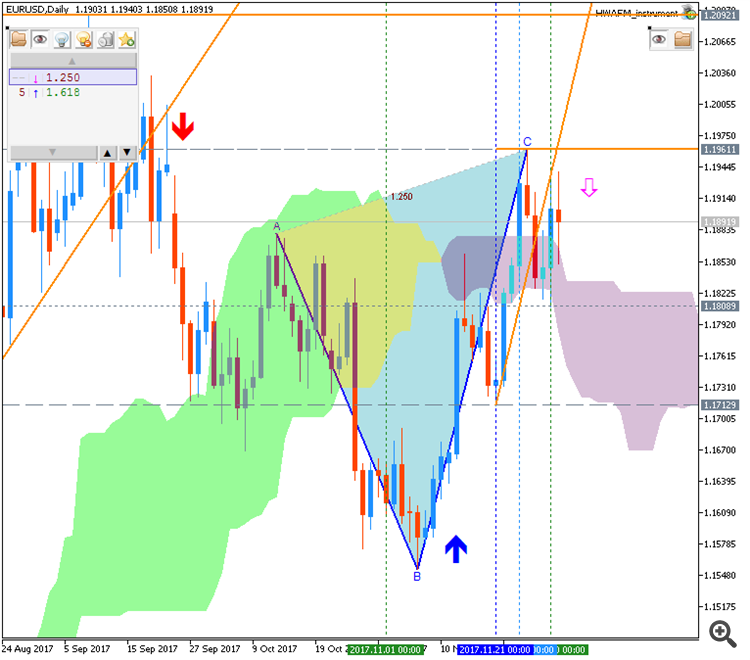
    Weekly EUR/USD Outlook: 2017, December 03 - December 10 (based on the article)

    EUR/USD struggled to continue advancing as the dollar found its footing. The upcoming week features a constant stream of data including PMIs, industrial output and more. Here is an outlook for the highlights of this week.


    1. Eurogroup Meetings: Monday. Progress in Greece’s program, political uncertainty in Germany, Italy, and still in Spain, and Brexit are all on the agenda.
    2. Spanish Unemployment Change: Monday, 8:00. A rise of 56.8K in unemployment was quite disappointing in October, despite the seasonal effect.
    3. Sentix Investor Confidence: Monday, 9:30.
    4. PPI: Monday, 10:00. A more modest rise is likely now.
    5. Services PMIs: Tuesday morning: 8:15 for Spain, 8:45 for Italy, final French figures at 8:50, final German figures at 8:55 and the final euro-zone numbers at 9:00.
    6. Retail Sales: Tuesday, 10:00. In September, the volume of sales increased by 0.7%, a recovery after two months of drops.
    7. GDP (revised): Tuesday, 10:00. A confirmation of the figure is expected now.
    8. German Factory Orders: Wednesday, 7:00. We may see a slide for the month of October.
    9. Retail PMI: Tuesday, 9:10. The number for October could be slightly higher.
    10. German Industrial Production: Thursday, 7:00.
    11. French Trade Balance: Thursday, 7:45.
    12. German Trade Balance: Friday, 7:00. The high surplus keeps the euro bid.
    13. French Industrial Production: Friday, 7:45.
     

    EUR/USD - long-term rally to the bullish reversal; 1.2091 is the long-term resistance for bullish (based on the article)

    Price on the monthly chart is near and below Ichimoku cloud for the trying to be reversed to the primary bullish market condition. Chinkou Span line broke historical price to above for the secondary rally within the bearish trend, and the price is testing resistance level at 1.2091 to above to be reversed to the primary bullish market condition.


    • "Heading into last week we were optimistic on the prospect of a higher EUR/USD, and while it was relatively unchanged when the dust settled there is reason to believe we will see higher prices in the days ahead. But if the euro doesn’t get into gear soon it runs the risk of breaking lower. So, we’ll approach this with an objective eye and continue to lean on the trend-line rising up from last month’s low as key to the near-term outlook. It was thoroughly tested during a 24-hr stretch on Thursday and Friday. There was some ‘help’ Friday on the Flynn/Trump headline which spooked dollar longs across the board, but looking at this from a pure technical standpoint – the line held. As long as it continues to do-so, then a rally is seen as likely to continue to mount towards the yearly highs."
    • "Levels on the top-side to watch are 11961, 12005, 12034, and then the big high at 12092. We may or may not see the yearly high challenged this coming week, but we’ll stay the course as long as there isn’t a break back below the aforementioned trend-line, and at worst, if that trend-line breaks we’ll give it to last week’s swing-low at 11809 before turning neutral at the least, if not flipping the script all together. In which case, attention will be placed on the area surrounding 11700 as it has been quite important on several occasions August."

    ==========

    The chart was made on MN1 timeframe with standard indicators of Metatrader 4 except the following indicators (free to download):


    AUD/USD Intra-Day FundamentalsAustralia Company Gross Operating Profits and range price movement 

    2017-12-04 00:30 GMT | [AUD - Company Operating Profits]

    • past data is -3.3%
    • forecast data is 0.3%
    • actual data is -0.2% according to the latest press release

    if actual > forecast (or previous one) = good for currency (for AUD in our case)

    [AUD - Company Operating Profits] = Change in the total value of profits earned by corporations. 

    ==========

    From official report :

    • "The trend estimate for inventories rose 0.1% in the September quarter 2017. The seasonally adjusted estimate rose 0.2% this quarter."
    • "The seasonally adjusted estimate for company gross operating profits fell 0.2% in the September quarter 2017."

    ==========

    AUD/USD M5: range price movement by Company Gross Operating Profits news event 


    ============

    Chart was made on MT5 with BrainTrading system (MT5) from this thread (free to download) as well as the following indicators from CodeBase:

    All about BrainTrading system for MT5:

    5676.0 - Business Indicators, Australia, Sep 2017
    • www.abs.gov.au
    SEPTEMBER KEY FIGURES SEPTEMBER KEY POINTS CHAIN VOLUME ESTIMATES The trend estimate for inventories rose 0.1% in the September quarter 2017. The seasonally adjusted estimate rose 0.2% this quarter. The trend estimate for Manufacturing sales of goods and services rose 0.9% this quarter. The seasonally adjusted estimate rose 2.0% this...
     

    Turkish Lira - bullish breakout; 3.98 is the key (based on the article)

    Weekly price was bounced from 3.38 bearish reversal level to above for the bullish breakout: the price is testing resistance level at 3.98 for the breakout to be continuing.


    • "The quality of the lira has been dramatically deteriorating since 2008.  The net foreign reserves on the Central Bank of Turkey’s balance sheet have plunged since the summer of 2009 from over 100% of reserve money into negative territory.  To keep the money supply growing, the Central Bank has replaced its disappearing foreign assets with those denominated in lira."

    ============

    Chart was made on MT5 with BrainTrading system (MT5) from this thread (free to download) as well as the following indicators from CodeBase:

    All about BrainTrading system for MT5:


    NZD/USD - weekly bearish breakdown (based on the article)

    Weekly price broke Ichimoku cloud to below for the breakdown with the bearish reversal: the price is testing support level at 0.6779 to below for the bearish trend to be continuing.


    • "The dominant New Zealand Dollar trend continues to favor the downside against its US counterpart despite an apparent deceleration in the pace of decline. The steeper down move from the late September swing high seems to have ended but a shallower series of lower highs and lows remains in play."
    • "From here, a daily close below the November 17 low at 0.6781 exposes range floor support at 0.6752, followed by the 38.2% Fibonacci expansion at 0.6697. Alternatively, a push above 0.6935 (23.6% Fib retracement, channel top) exposes the 0.7030-54 area (38.2% retracement, October 9 low, former trend line support)."
    • "Risk/reward considerations argue against taking a short trade at current levels. With that in mind, a short entry order has been established to sell NZD/USD at 0.6895. If triggered, the trade will initially target 0.6793 and carry a stop-loss activated on a daily close above 0.6946."

    ============

    Chart was made on MT5 with BrainTrading system (MT5) from this thread (free to download) as well as the following indicators from CodeBase:

    All about BrainTrading system for MT5:

    Reason: