Press review - page 518


NZD/USD - bearish ranging; 0.6820 level is the key (based on the article)

Daily price is on ranging below Ichimoku cloud in the ebarish area of the chart: the price is testing 0.6820 support level to below for the bearish trend to be resumed.


  • "The NZD/USD is trading off of new lows this morning, as the RBNZ (Reserve Bank of New Zealand) elected to keep key interest rates at 1.75%. While the decision to keep rates flat was not surprising, statements made by RBNZ’s Wheeler later in the session took a dovish stance. This news directly sent the NZD/USD to levels not seen since June of 2016."
  • "Traders should note that the NZD/USD is now trading in a downtrend, with prices below both its 10 day EMA (exponential moving average) and 200 day MVA (simple moving average). Also the pair is set to close below .6862, which is the December 2016 swing low. A move to this point places the NZD/USD at new yearly lows, and suggests that the pair may fall further. In the event of a bullish reversal, traders should first look for prices to trade back above .6862, and then challenge the 10 day EMA found at .6888."

NZD/USD Trades to Yearly Lows on RBNZ News
  • DailyFX
  • www.dailyfx.com
The NZD/USD is trading off of new lows this morning, as the RBNZ (Reserve Bank of New Zealand) elected to keep key interest rates at 1.75%. While the decision to keep rates flat was not surprising, statements made by RBNZ’s Wheeler later in the session took a dovish stance. This news directly sent the NZD/USD to levels not seen since June of...
 

Trading Lesson: Moving Averages and the direction of the trend (based on the article)


"Finding the direction of current market momentum is an important step for trend traders. Moving averages are a unique tool that help traders to just that on a variety of charts and time frames. A 200 period MVA (simple moving average) is often employed for this task, with traders looking to see if prices are currently above or below the average. If prices are trading above the 200 period MVA, the trend and market momentum may be interpreted as rising. As well if prices are below the average, this may be interpreted as a declining market."


"Often times, one line of reference may not be beneficial to a trader. To get a more complete look at momentum, traders may employ a series of MVA’s. Typical averages include the 20,50, and 200 period MVA’s. While the settings of the averages can be changed, traders should consider having a short, mid, and long term MVA for reference. In an uptrend, the shortest moving average should reside above the mid and long term lines. Alternatively in a downtrend, the short term average should be below both the mid and long term lines."


"Lastly, once traders are familiar with traditional averages, traders may expand their knowledge base to include other interpretations of moving averages. EMA’s (Exponential moving average) are similar to traditional MVA’s, however these lines are weighted. This means EMA’s are more sensitive to change in present market price than traditional MVA’s. Their sensitivity makes them a great tool for finding short term shifts in momentum on longer term charts."


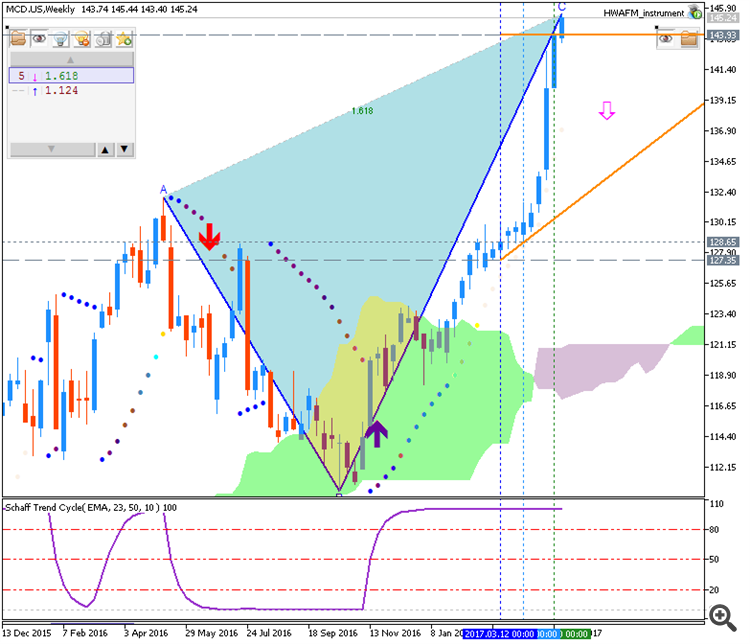
USD/CAD and Brent Crude Oil - USD/CAD for the bullish continuation with Brent Crude Oil for the bearish reversal (based on the article)

Daily price is above Ichimoku cloud for the bullish market condition with the ranging within the narrow support/resistance levels:

  • 1.3793 resistance located the beginning of the bullish trend to be resumed, and
  • 1.3641 support level located in the beginning of the secondary correction to be started.

There is good correlation with Brent Crude Oil chart so if USD/CAD is continuing with the bullish trend so we may see Brent Oil daily price to be reversed to the primary bearish condition.


  • "The bid in Crude Oil over the last few sessions has been welcomed news for CAD longs, which benefit when USD/CAD falls. However, the news out of the energy market may not stay supportive for long. On Thursday, OPEC raised their 2017 estimate of supply growth from non-OPEC producers (i.e., US Shale) by 46%, which is a direct threat to the supply curbs put in place by OPEC and Russia and expected to be extended to help rebalance the market. While there has been a bounce in Crude Oil over the last few sessions, hopeful bulls should be reminded we traded at 5-month lows last week, and we continue to get information showing that global demand may be falling, not rising as total supply is not falling as much as originally planned. "
  • "Despite the recent concerns, USD/CAD has yet to trade above the May 5 and 2017 high of 1.3793. However, the recent volatile price action and discouraging undertones for drivers of CAD value may favor further CAD weakness and USD/CAD upside. The short-term zone of support for the uptrend is 1.3598 (December 28 high) and 1.3875 (38.2% retracement of the April-May range.) Should the price continue to close above this zone on a daily basis, the current sideways price action is preferred to be seen as a precursor before a move to new 2017 highs and toward the long-term target of 1.3838 (61.8% Fibonacci retracement of the 2016 range.)"

============

This technical analysis was provided with the following indicators from CodeBase:

  1. MFCS Currency Correlation Chart - indicator for MetaTrader 5
  2. MaksiGen_Range_Move MTF - indicator for MetaTrader 5 
  3. ColorParabolic_Alert - indicator for MetaTrader 5
  4. BrainTrend2Sig - indicator for MetaTrader 5 (and same indicator with alert)
  5. Ichimoku Cloud - indicator for MetaTrader 5
  6. TrendlinesDay - indicator for MetaTrader 5
USD/CAD Technical Analysis: Volatility Up Near YTD Highs
  • DailyFX
  • www.dailyfx.com
USD/CAD upside momentum currently stalled, watching support at 1.3575 The bid in Crude Oil over the last few sessions has been welcomed news for CAD longs, which benefit when USD/CAD falls. However, the news out of the energy market may not stay of supply growth from non-OPEC producers (i.e., US Shale) by 46%, which is a direct threat to the...
 

Intra-Day Fundamentals - EUR/USD, AUD/USD and Bitcoin (BTC/USD): U.S. Retail Sales and Consumer Price Index (CPI)

2017-05-12 13:30 GMT | [USD - Retail Sales]

  • past data is 0.1%
  • forecast data is 0.6%
  • actual data is 0.4% according to the latest press release

if actual > forecast (or previous one) = good for currency (for USD in our case)

[USD - Retail Sales] = Change in the total value of sales at the retail level.

==========

2017-05-12 13:30 GMT | [USD - CPI]

  • past data is -0.3%
  • forecast data is 0.3%
  • actual data is 0.2% according to the latest press release

if actual > forecast (or previous one) = good for currency (for USD in our case)

[USD - CPI] = Change in the price of goods and services purchased by consumers.

==========

From marketwatch article:

  • "U.S. stocks looked set to pull back again Friday, ahead of data on the struggling retail sector and on consumer prices, in what has largely been a losing week clouded by political worries. Dow Jones Industrial Average futures YMM7 slipped 18 points to 20,852, while S&P 500 futures ESM7 dipped 3.85 points, or 0.2%, to 2,387.25 and Nasdaq-100 futures NQM7 eased 2.75 points, or 0.1%, to 5,668."
  • "The retail-sales data for April is expected to come at 8:30 a.m. Eastern Time. Economists polled by MarketWatch forecast a rebound of 0.5% growth from declines in March and February. Those declines contributed to a broader slowdown in consumer spending in the first quarter, the weakest in eight years."
  • "At the same time, inflation numbers will be released. Economists expect the core consumer-price index rose 0.2%, from a 0.1% fall in March."

==========

EUR/USD M5: range price movement by Retail Sales and CPI news events


==========

AUD/USD M5: range price movement by Retail Sales and CPI news events


==========

BTC/USD M5: range price movement by Retail Sales and CPI news events


What is the difference between CNY and CNH currencies? (based on the article)

"Prior to the establishment of the yuan offshore market, China's capital control rules did not allow renminbi (denoted CNY) to be traded outside of China.  In-fact, it was a proposal by the Hong Kong Monetary Authority to allow renminbi trading in Hong Kong that opened the dialog of an offshore renminbi market." 


"On July 19th, 2010, the People's Bank of China (PBOC) and the HKMA jointly announced that the renminbi would be deliverable in Hong Kong, thus creating the offshore renminbi (CNH) market where foreign individuals and corporations are allowed to buy, hold or sell CNH.  These investors are restricted from participating in the onshore CNY market (aside from Qualified Foreign Institutional Investors)."


"These developments were part of China's path toward internationalization of the renminbi, and to make it an international trade currency of choice (latest achievement being renminbi's inclusion into the IMF's SDR)."

What is the difference between CNY and CNH currencies? - Quora
  • www.quora.com
Hi guys, I am working at fintech startup , where we are helping businesses with their payments to China…so my answer might seem a bit “advanced”. The content below mainly came from an internal document aimed at clearing up some misunderstandings within our team on the difference between onshore and offshore renminbi. I hope it’s also helpful...
 

Weekly Outlook: 2017, May 14 - May 21 (based on the article)


The second week of May saw the dollar gaining ground against many currencies despite a political controversy. A mix of events awaits us now: GDP from Japan, jobs from Australia, and housing data from the US.


    1. Chinese Industrial Production: Monday, 2:00. After a surprising rise of 7.6% last time, the figure for April could be weaker: 7% is expected.
    2. Euro-zone GDP: Tuesday, 9:00. No change is expected.
    3. US housing data: Tuesday, 12:30. Building permits are projected to remain at 1.27 million and housing starts to rise to 1.27 million.
    4. UK jobs report: Wednesday, 8:30. Wages are predicted to advance to 2.4% y/y and the unemployment rate is likely to stay at 4.7%.
    5. Oil inventories: Wednesday, 14:30.
    6. Japanese GDP: Wednesday, 23:50. The economy of the third-largest global economy probably expanded also in early 2017: +0.4% is forecast.
    7. Australian jobs report: Thursday, 1:30. A modest gain of 5.2K is estimated and the unmeployment rate will likely stay at 5.9%.
    8. US jobless claims: Thursday, 12:30. A small rise from 236K to 240K is expected.
    Forex Weekly Outlook - May 15-19 2017 | Forex Crunch
    Forex Weekly Outlook - May 15-19 2017 | Forex Crunch
    • 2017.05.12
    • Yohay Elam
    • www.forexcrunch.com
    The second week of May saw the dollar gaining ground against many currencies despite a political controversy. A mix of events awaits us now: GDP from Japan, jobs from Australia, and housing data from the US. Here are the big events to look out for. Updates: Chinese Industrial Production: Monday, 2:00. The world´s second-largest economy has...
     

    Weekly EUR/USD Outlook: 2017, May 14 - May 21 (based on the article)

    EUR/USD took Macron’s victory with a stride, having priced in the election from the outset. GDP and inflation data stand out in the third week of May.


    1. French CPI (final): Tuesday, 6:45. The final read will likely confirm it.
    2. Italian GDP: Tuesday, 8:00. After 0.2% in Q4 2016, the exact same rate is predicted now.
    3. GDP: Tuesday, 9:00. A repeat is predicted.
    4. German ZEW Economic Sentiment: Tuesday, 9:00. Another upbeat number could follow: 22.3 is predicted. The all-European figure is also predicted to advance: from 26.3 to 29.1 points.
    5. Trade Balance: Tuesday, 9:00. A similar figure is on the cards now: 18.8 billion.
    6. CPI (final): Wednesday, 9:00. The preliminary inflation estimates showed a pickup in inflation in April: 1.9% on the headline and a surprisingly strong jump in core inflation at 1.2%. The final read should confirm these early assessments.
    7. German PPI: Friday, 6:00. April could see PPI picking up: +0.2%.
    8. Current Account: Friday, 8:00. It is now forecast to dip to 32.3 billion.
    9. Consumer Confidence: Friday, 14:00. A score of -4 was seen in April and a small rise to -3 is forecast now.
    EUR/USD Forecast May 15-19 2017 | Forex Crunch
    EUR/USD Forecast May 15-19 2017 | Forex Crunch
    • 2017.05.12
    • Yohay Elam
    • www.forexcrunch.com
    EUR/USD took Macron’s victory with a stride, having priced in the election from the outset. GDP and inflation data stand out in the third week of May. Here is an outlook for the highlights of this week and an updated technical analysis for EUR/USD. Updates: EUR/USD daily chart with support and resistance lines on it. Click to enlarge: French...
     

    USD/CNH Intra-Day Fundamentals: China Industrial Production and range price movement 

    2017-05-15 03:00 GMT | [CNY - Industrial Production]

    if actual > forecast (or previous one) = good for currency (for CNY in our case)

    [CNY - Industrial Production] = Change in the total inflation-adjusted value of output produced by manufacturers, mines, and utilities. 

    ==========

    From official report:

    • "China's industrial production and retail sales growth decelerated more-than-expected in April reflecting weak foreign demand and domestic spending at the start of second quarter, data published by the National Bureau of Statistics showed Monday."
    • "Industrial production expanded 6.5 percent year-on-year in April, weaker than the 7.6 percent rise in March. Economists had forecast a 7 percent increase."

    ==========

    USD/CNH M5: range price movement by China Industrial Production news event


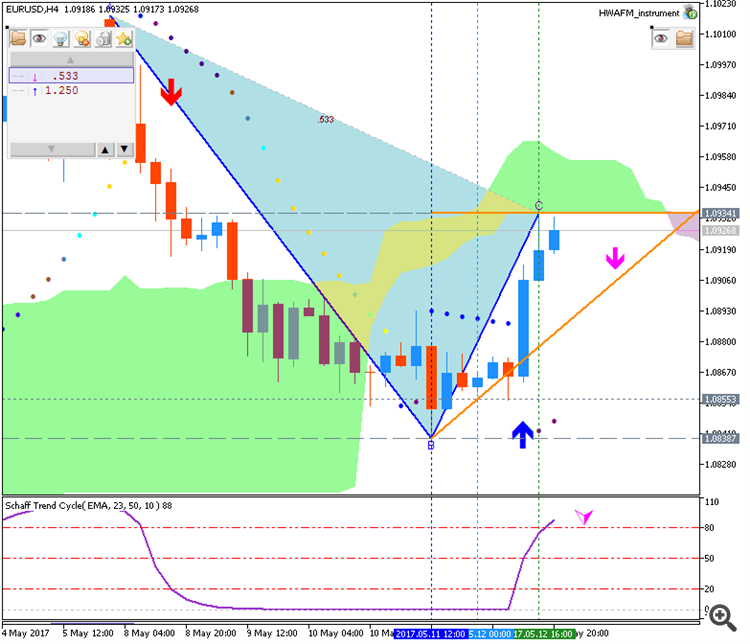
    EUR/USD - Bullish ranging within narrow s/r channel (based on the article)

    Daily price is above Ichimoku cloud for the bullish market condition with the ranging within 1.1017 resistance level and 1.0838 support level.

    If the price breaks 1.1017 resistance on close daily bar so the bullish trend will be resumed.
    If the daily price breaks 1.0838 support on close bar so the secondary correction will be started.
    If not so the price will be on bullish ranging within the levels.


    • "In fact, traders have remained net-short since Apr 18 when EURUSD traded near 1.06101; price has moved 3.5% higher since then. The number of traders net-long is 6.2% lower than yesterday and 12.5% lower from last week, while the number of traders net-short is 17.7% higher than yesterday and 27.8% higher from last week."

    Euro Bullish as Traders are Short
    Euro Bullish as Traders are Short
    • DailyFX Research
    • www.dailyfx.com
    EURUSD: Retail trader data shows 29.2% of traders are net-long with the ratio of traders short to long at 2.43 to 1. In fact, traders have remained net-short since Apr 18 when EURUSD traded near 1.06101; price has moved 3.5% higher since then. The number of traders net-long is 6.2% lower than yesterday and 12.5% lower from last week, while the...
     

    AUD/USD Intra-Day Fundamentals: RBA Meeting Minutes and range price movement 

    2017-05-16 02:30 GMT | [AUD - Monetary Policy Meeting Minutes]

    [AUD - Monetary Policy Meeting Minutes] = It's a detailed record of the RBA Reserve Bank Board's most recent meeting, providing in-depth insights into the economic conditions that influenced their decision on where to set interest rates. 

    ==========

    From seekingalpha article:

    • "The RBA held at a record low 1.5% in the May meeting, and in the minutes said, "developments in the labor market and housing markets warranted careful monitoring." Still, RBA Governor Philip Lowe has made it clear in recent speeches he would be reluctant to lower interest rates any further, saying the vast debts carried by the average Australian household could slow GDP growth if unrestrained."
    • "AUD/USD traded at 0.7422, up 0.12%, while USD/JPY traded at 113.54, down 0.21%. The Reserve Bank of Australia released the minutes from its May meeting and focused on the overheated housing market and signs of softness in job creation as key signposts for the direction of interest rates."

    ==========

    AUD/USD M5: range price movement by RBA Meeting Minutes news event

    Minutes of the Monetary Policy Meeting of the Board | RBA
    • www.rba.gov.au
    Minutes of the monetary policy meetings of the Reserve Bank Board are published two weeks after each meeting, and explain the monetary policy decision. The Reserve Bank Board normally meets eleven times each year, on the first Tuesday of each month, except January.
    Reason: