Join our fan page

TandemInstrument - indicator for MetaTrader 5

- Views:
- 15376
- Rating:
- Published:
-
 You are missing trading opportunities:
- Free trading apps
- Over 8,000 signals for copying
- Economic news for exploring financial markets
Registration Log inYou agree to website policy and terms of use
If you do not have an account, please register -
 Need a robot or indicator based on this code? Order it on Freelance
Go to Freelance
Need a robot or indicator based on this code? Order it on Freelance
Go to Freelance
This indicator implements visualization of pair trading method (searching for divergences). Tandem Expert Advisor uses the same method (https://www.mql5.com/en/code/955).

Fig. 1. Overlaying EURUSD chart on GBPUSD. Common H1 timeframe
Fig.1 shows the example of the indicator application. It can clearly be seen that pairs diverged for a certain distance and started converging again. At the next similar divergence, the upper pair should be sold, while the lower one should be bought. When pairs start converging, both deals should be closed. One deal will be closed with a loss, while another one will fix a profit exceeding the loss.
The following parameters were used in the above example:
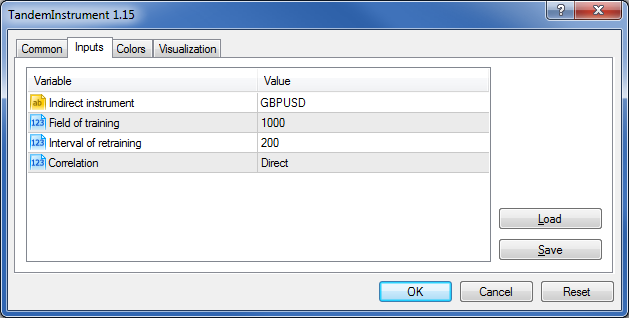
Fig.2. TandemInstrument indicator parameters used in the example
History of changes:
September 8, 2012
- improved the indicator code considering possible holes in an indirect symbol;
added data on an indirect symbol's density (the ratio, by which the sizes of an indirect symbol's candles are multiplied before they are displayed on the main symbol's chart) to the chart window comment.
Translated from Russian by MetaQuotes Ltd.
Original code: https://www.mql5.com/ru/code/991
RSI HTF
Standard RSI that can be applied for a chart having a different timeframe.
Smoothed Simple Trend Detector
Smoothed Simple Trend Detector.
i-BB-Width
Bollinger Bands Width. One of its application methods was described in FOREX Magazine №123 (July 2006) on page 47.
Simple Trend Detector
Same RSI and Dem but more sensitive one.