Join our fan page
- Views:
- 41980
- Rating:
- Published:
- Updated:
-
Need a robot or indicator based on this code? Order it on Freelance Go to Freelance
This indicator is a developed idea of using normalized volumes (Normalized Volume).
First of all, the normalized values are now expressed in percentage of the average value for a period. Accordingly, the data on the chart can now take negative values, too. This will mean some lull on the market.
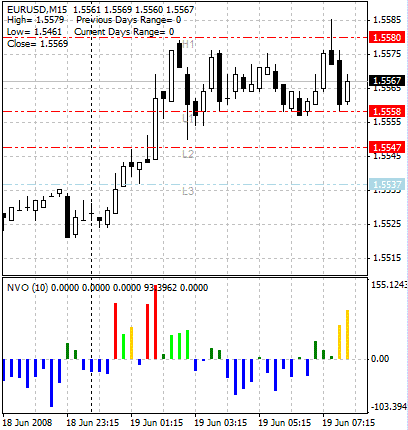
Another useful innovation is coloring histogram bars according to the normalized volume size.
- Blue color means that the current volume is less than the average one for this period.
- Dark green color means a small exceeding in volume as compared to the average one for this period.
- Light green color means that the increase in volume has exceeded the Fibo level of 38.2% as compared to the average one for this period.
- Yellow color means that the increase in volume has exceeded the Fibo level of 61.8% as compared to the average one for this period.
- White (it is red in the image below not to melt into the background) color means that the increase in volume has exceeded the Fibo level of 100% as compared to the average one for this period.

Осциллятор нормализованного объема
In the image above, you can see an example of how to use Normalized Volume Oscillator when analyzing the probability of breaking through pivot levels.
The yellow bar of the histogram says that the breaking through is very probable in the nearest future. White (red in the picture above) bar informs us that the breaking through is taking place just now and, most probably, it is true.
The indicator works best on comparatively small timeframes (15 minutes, for example).
On longer trends, the break-through conditions are "cushioned", since the general volume level for the period is high. In this case, it is sufficient that the histogram bar is green.
Translated from Russian by MetaQuotes Ltd.
Original code: https://www.mql5.com/ru/code/8208
 LSMA in Color
The indicator is build on the basis of moving averages. Its main feature is entering/leaving signal - the indicator's line is colored in a certain color signaling for the user to buy or to sell. The accuracy of the signal is very high.
 The MasterMind
Demo it First... $5000 Flipped To $243K in 3 Months. Coders Needed, Not Finished.
 ZigZagHistory
Besides already fixed bars, the indicator shows the intermediate static positions of the ZigZag indicator. It will be helpful for those developing systems based on ZigZag.
 MACDonRSI
The MACD indicator is built on the basis of RSI that, in its turn, is built on MA.