Join our fan page
- Views:
- 10529
- Rating:
- Published:
- Updated:
-
Need a robot or indicator based on this code? Order it on Freelance Go to Freelance
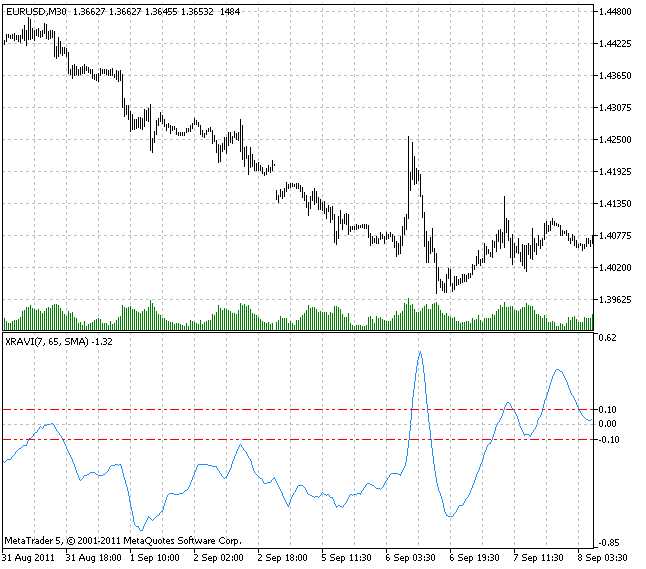
There is a quite useful indicator developed by Т. Chande which is called RAVI (Range Action Verification Index).
The principle of its generation is different from the one used to build the ADX indicator. Chande suggested 13 week SMA as a basis of the RAVI indicator that represents quarter states (quarter – 3 months or 65 working days) of the market participants mood concerning prices. The short average that includes the RAVI indicator comprises 10% from the long one and is equal to seven in rough figures.
RAVI indicator can be expressed the following way:
RAVI = 100*(SMA(7) - SMA(65)) / SMA(65)
where SMA(period) - simple moving average with the period equal to the period.
Chande suggested the following reference lines for the RAVI indicator: plus-minus 0.3% or plus-minus 0.1% is selected depending on the market peculiarities. When the RAVI indicator line crosses the reference line upwards, this is a signal for a new uptrend. When the indicator crosses its reference line downwards, this is a signal for a downtrend. A trend is most likely to continue its growth, while the RAVI indicator line is rising, and it will probably continue its fall, while the RAVI line is going down.
Reversal of the RAVI indicator to the zero line shows that a trend is over and a channel is appearing (forex channel strategy). But repeated reversal of the indicator without entering into a reference lines range shows that a trend is resumed.
Chande's RAVI indicator is quite simple. It is very similar to the MACD and Price Oscillator indicators. The unique feature of RAVI is that it uses the movement convergence-divergence as a trend indicator considering divergence (not crossing) of the averages.
We know that ADX has two smoothings. RAVI has only one. Therefore, RAVI with previously mentioned values is more sensitive and can signal about the beginnig or end of a trend earlier than 18 day ADX.
This indicator allows to select a smoothing type out of ten possible versions:
- SMA - simple moving average;
- EMA - exponential moving average;
- SMMA - smoothed moving average;
- LWMA - linear weighted moving average;
- JJMA - JMA adaptive average;
- JurX - ultralinear smoothing;
- ParMA - parabolic smoothing;
- T3 - Tillson's multiple exponential smoothing;
- VIDYA - smoothing with the use of Tushar Chande's algorithm;
- AMA - smoothing with the use of Perry Kaufman's algorithm.
It should be noted that Phase type parameters for different smoothing algorithms have completely different meaning. For JMA it is an external Phase variable changing from -100 to +100. For T3 it is a smoothing ratio multiplied by 100 for better visualization, for VIDYA it is a CMO oscillator period and for AMA it is a slow EMA period. In other algorithms these parameters do not affect smoothing. For AMA fast EMA period is a fixed value and is equal to 2 by default. The ratio of raising to the power is also equal to 2 for AMA.
The indicator uses SmoothAlgorithms.mqh library classes (must be copied to the terminal_data_folder\MQL5\Include). The use of the classes was thoroughly described in the article "Averaging Price Series for Intermediate Calculations Without Using Additional Buffers".
This indicator was first implemented in MQL4 and published in CodeBase 15.02.2008.

Translated from Russian by MetaQuotes Ltd.
Original code: https://www.mql5.com/ru/code/516
 Matrix operations library
The library provides simple matrix operations: addition, subtraction, multiplication, inversion.
 XVSI
XVSI
The indicator that calculates the volume corresponding to MA per second (or period).
 Cronex Super Position
Superposition of RSI and DeMarker technical indicators.
 Demand Index
The Demand Index combines price and volume in such a way that it is often a leading indicator of price change.