 MetaTrader 5
 Experts
 Indicators
 Scripts
 Libraries
 Storage
Watch how to download trading robots for free
Find us on Telegram!
Join our fan page
Join our fan page
You liked the script? Try it in the MetaTrader 5 terminal

LRMA_Channel_trajectory - indicator for MetaTrader 5
Mykola Demko

Programming languages mql4, mql5
My articles:
The Use of ORDER_MAGIC for Trading with Different Expert Advisors on a Single Instrument
Evaluation of Trade Systems - the Effectiveness of Entering, Exiting and Trades in General
How to Copy Trading from MetaTrader 5 to MetaTrader 4
My articles:
The Use of ORDER_MAGIC for Trading with Different Expert Advisors on a Single Instrument
Evaluation of Trade Systems - the Effectiveness of Entering, Exiting and Trades in General
How to Copy Trading from MetaTrader 5 to MetaTrader 4
- Views:
- 10442
- Rating:
- Published:
- Updated:
-
 You are missing trading opportunities:
- Free trading apps
- Over 8,000 signals for copying
- Economic news for exploring financial markets
Registration Log inYou agree to website policy and terms of use
If you do not have an account, please register -
 Need a robot or indicator based on this code? Order it on Freelance
Go to Freelance
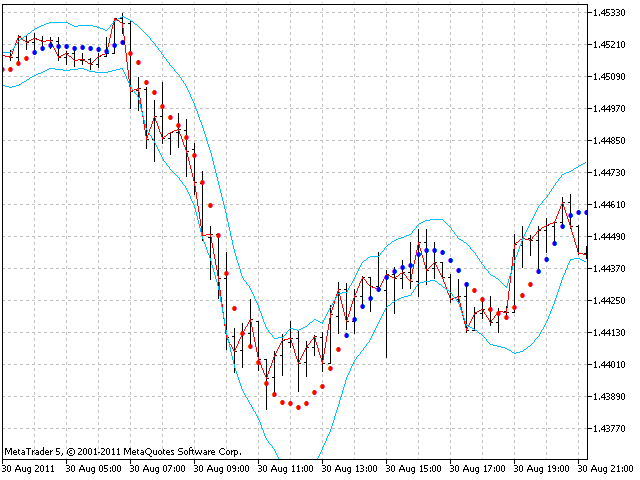
The dots, shown by the indicator are based on the linear regression. Regression period is set by the lr_per input parameter.
Two arrays are used to build the regression trajectory: LR_up draws the trajectory of ascending parts and LR_down draws the trajectory of descending parts. Deviation lines are controlled by stdev_koef deviation ratio. The indicator is created so that a trader can easily put any data instead of open prices by changing the code in one place only.
Translated from Russian by MetaQuotes Ltd.
Original code: https://www.mql5.com/ru/code/507
SuperTrend
SuperTrend trend indicator.
ZigZag on Parabolic
This ZigZag indicator is based on the Parabolic SAR technical indicator.
 cs2011
Automated Trading Championship 2011 version.
Stochastic RVI
Stochastic RVI is a standard Stochastic Oscillator applied to the values of RVI (Relative Vigor Index) indicator instead of a price.