Join our fan page
- Published by:
- Nikolay Kositsin
- Views:
- 14722
- Rating:
- Published:
- Updated:
-
Need a robot or indicator based on this code? Order it on Freelance Go to Freelance
Real author:
EarnForex
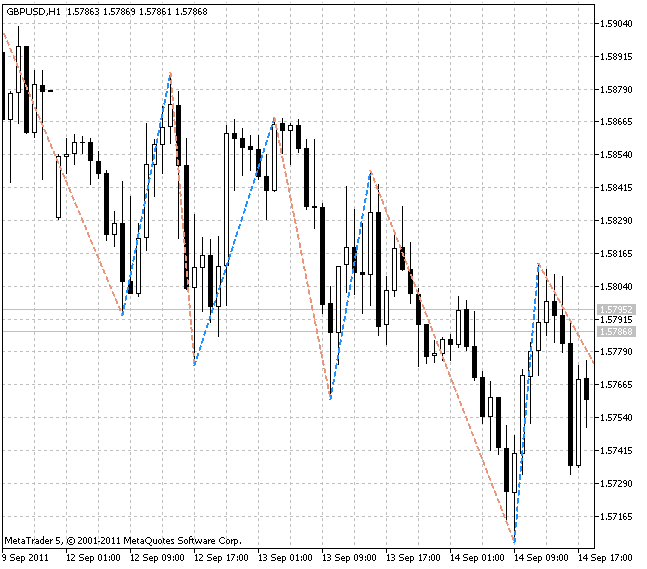
This indicator builds ZigZag based on the Parabolic SAR indicator. This is an advanced ZigZag version marking extreme values on a chart with less lag. The standard ZigZag looks for a new extreme value following the price percent deviation from a previous extreme value. This new indicator keeps track of a price crossing with Parabolic SAR.
Input parameters:
- Step (default value = 0.02) — standard Parabolic SAR indicator parameter;
- Maximum (default value = 0.2) — another standard Parabolic SAR indicator parameter;
- ExtremumsShift (default value = true) — if true, extreme values are shown at their actual location; if false, extreme values are shown at the time points where the indicator locates them. It helps to improve working with extreme values.

Translated from Russian by MetaQuotes Ltd.
Original code: https://www.mql5.com/ru/code/526
 Demand Index
The Demand Index combines price and volume in such a way that it is often a leading indicator of price change.
 Cronex Super Position
Superposition of RSI and DeMarker technical indicators.
 SuperTrend
SuperTrend trend indicator.
 LRMA_Channel_trajectory
The indicator builds the trajectory of the front linear regression and standard deviation points.